Certain video analytics metrics correlate directly with a viewer's conversion potential, but only when you know which ones to look for and how to read them together. This article covers the key metrics that predict conversion potential, how high-converting viewer behaviour differs across video types, and how to use these signals as a predictive system rather than isolated data points.
Why individual video metrics don't predict conversion on their own
A high completion rate confirms that a viewer watched a video. A CTA click confirms that they interacted. However, neither confirms that the customer was close to a buying decision. Video hosting platforms with built-in video analytics capture all of these signals together, but when they are read in isolation they describe individual moments of behaviour and miss the broader pattern that precedes a purchase.
A common video analytics mistake marketing teams make is optimising for the metrics that are easiest to report. View counts demonstrate reach. Completion rates demonstrate content quality. These are useful signals, but they were never designed to indicate purchase readiness. A viewer can complete a short brand video and have no intention of buying. Another can drop off a product demo at 60% having already decided to book a call. Single metrics cannot account for this complexity. Conversion potential becomes measurable when multiple signals align and are interpreted in the context of what a viewer was watching, when, and how often.
Video analytics metrics that predict conversion potential
The video analytics metrics that predict conversion potential are not equally valuable in every context. Their predictive strength depends on the type of video, where it sits in the funnel, and how they combine with other behavioural signals. Used together, these metrics form a clearer picture of which viewers are progressing toward a purchasing decision.
Watch depth on decision-stage content
Watch depth is a video analytics metric that measures how far into a video a viewer progresses. On awareness content, high watch depth signals interest. On decision-stage content like product demos, pricing walkthroughs, and implementation overviews, it signals active evaluation and stronger conversion potential. Viewers who consistently watch past the 75% mark on decision-stage videos show measurably higher conversion potential than those who stop watching early, regardless of total viewing volume.
Return viewing frequency and session recency
Return viewing frequency measures how often a viewer revisits a video or returns to platform content across multiple sessions. When combined with recency, it becomes one of the most reliable video analytics metrics for assessing conversion potential. A lead who rewatched a product demo twice within 48 hours signals stronger buying intent than one who watched the same video once three weeks ago. Recency confirms that evaluation is currently happening, meaning the lead is still in the decision-making process.
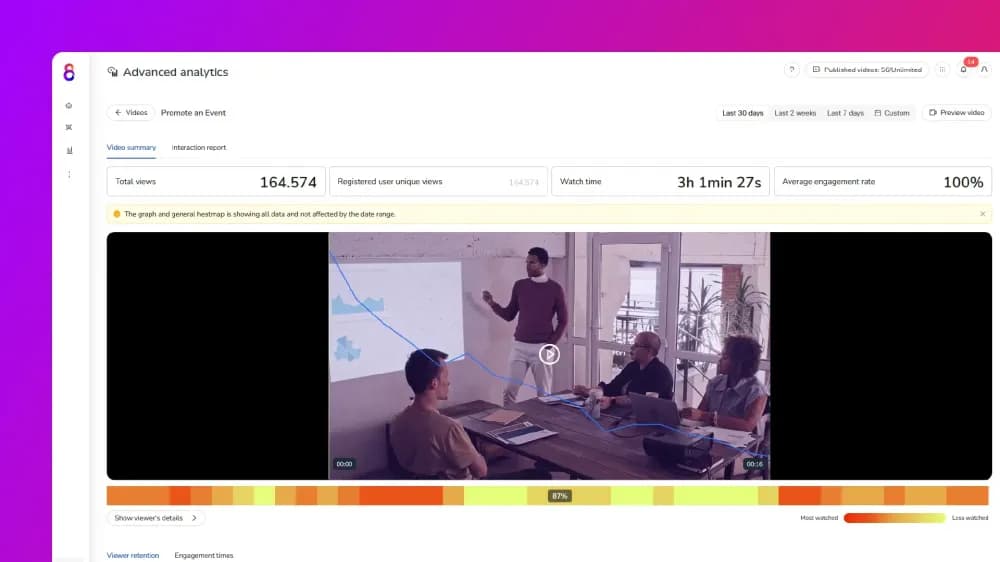
Heatmap engagement patterns
Video heatmaps are video analytics tools that show which sections of a video are watched most, rewatched, or skipped at an individual viewer level. High-converting viewers consistently concentrate attention on sections covering features, integrations, pricing, and implementation. When heatmap data shows repeated engagement with these decision-critical moments, it reflects structured evaluation and is a strong indicator of conversion potential.
Drop-off rate relative to CTA placement
Drop-off rate becomes a more powerful metric for conversion potential when it is analysed in relation to where calls to action appear in a video. A viewer who drops off immediately before a CTA placement is a meaningfully different signal from one who exits in the opening seconds. Late-stage drop-off, particularly after exposure to pricing or next-step prompts, often indicates hesitation and may warrant targeted follow-up from sales or marketing teams.
In-video interaction rate
In-video interaction rate measures how frequently viewers engage with clickable elements inside a video, including CTAs, hotspots, and embedded lead generation forms. It is among the strongest video analytics metrics for predicting conversion potential because it requires deliberate action. For e-commerce brands, this extends to shoppable video interactions where product clicks and overlay engagement indicate purchase intent at its most direct.When a high interaction rate is combined with strong watch depth on decision-stage content, the conversion potential of that viewer increases significantly.
Multi-video consumption within a session
Multi-video consumption within a single session is a video analytics pattern that reflects a buying mindset. Viewers who watch multiple decision-stage videos in sequence, particularly spanning demos, use cases, and pricing content, are conducting concentrated research. Single-video engagement indicates interest. Multi-video consumption within a short timeframe indicates active comparison and evaluation, and correlates strongly with higher conversion potential.
How to read video metrics as a predictive combination
No single video analytics metric predicts conversion potential with reliability. The predictive value comes from recognising when multiple behavioural signals occur together, forming a pattern that consistently precedes a purchase decision. This is what separates a video analytics strategy from a video reporting strategy.
High-converting viewers typically exhibit three or more of the following signals in close proximity:
- Watching past the 75% threshold on at least one piece of decision-stage content
- Returning to the same video or content within a short timeframe
- Concentrated heatmap engagement on pricing, features, or implementation sections
- Late-stage drop-off or interaction with an in-video CTA
- Multi-video consumption across decision-stage assets within a single session
The proximity of these behaviours matters as much as their presence. Recency and concentration of engagement are what give the combination its predictive weight. The most accurate conversion fingerprint for your business comes from analysing the behaviour of leads who have already converted and then working backwards to identify what they had in common.
What conversion prediction looks like across different video types
The same video analytics metrics behave differently depending on the type of video being watched. Understanding what strong conversion potential looks like across different formats helps marketing teams interpret signals more accurately and avoid drawing the wrong conclusions from their data.
Product demos
Product demos are the highest-intent video format for most B2B marketing teams. Significant watch depth, combined with replay behaviour on feature or pricing sections, is a strong conversion signal. A viewer who returns to a demo within 48 hours of their first session is exhibiting concentrated evaluation behaviour and should be treated as a high-priority lead.
Explainer videos
Explainer videos sit earlier in the funnel and generate softer signals. High watch depth on an explainer indicates relevance and problem awareness, but it only becomes a meaningful conversion potential indicator when followed by engagement with decision-stage content. On its own, strong explainer performance reflects audience fit more than purchase readiness.
Webinars and long-form video
For longer content, raw completion rate is rarely a reliable conversion metric. Instead, heatmap data and chapter-level watch depth are more informative. Viewers who concentrate attention on product-specific or implementation sections of a webinar, rather than the broader educational content, are demonstrating stronger conversion potential than what overall watch time may suggest.
Customer stories and case studies
Engagement with customer story videos is a strong mid-to-late funnel signal. Viewers who seek out and complete case study content are typically in comparison mode. When this behaviour occurs alongside demo engagement or CTA interaction, it forms part of a reliable conversion fingerprint.
How to use your video hosting platform to surface conversion potential
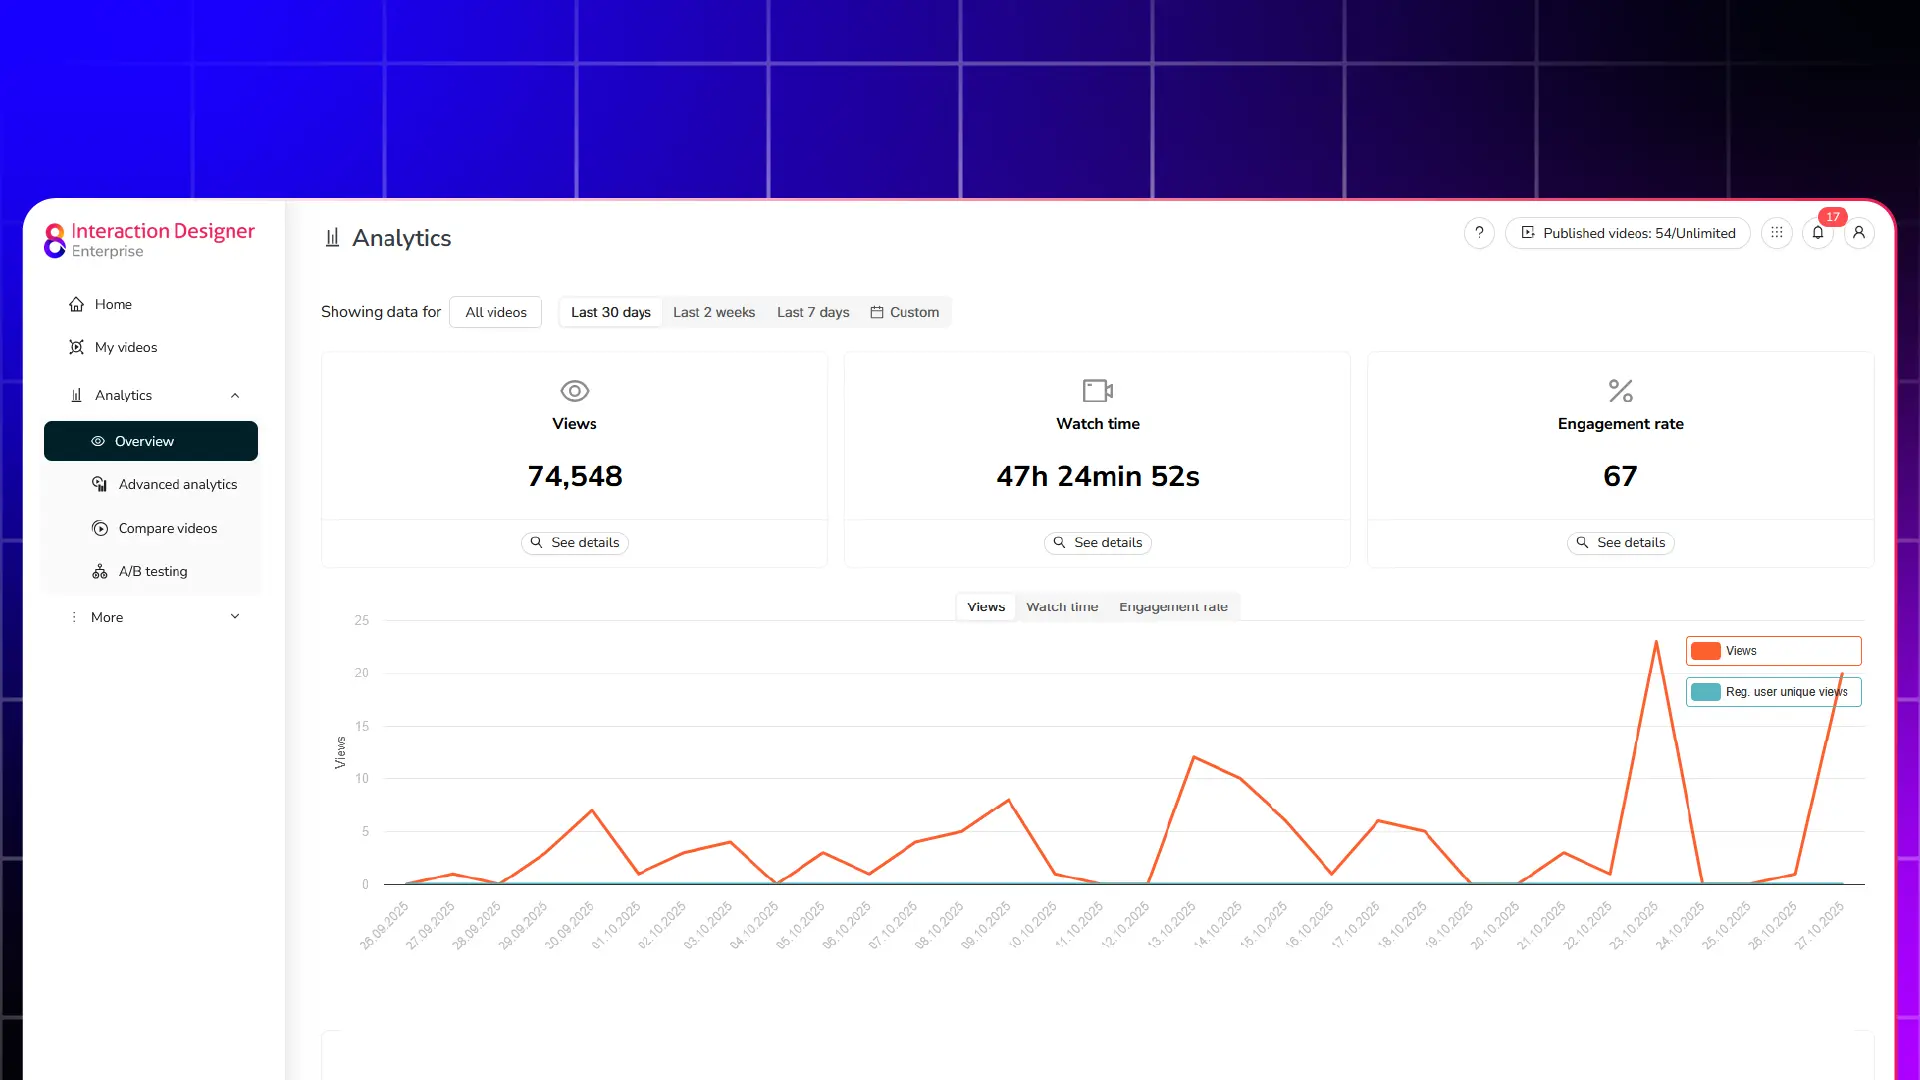
Video analytics metrics only become actionable when your video hosting platform is built to capture and surface them at the viewer level. Aggregate data shows how a video performs across an audience. Viewer-level data shows how a specific lead is behaving, which is what conversion potential analysis requires.
Your platform should tie engagement data to identifiable viewers rather than anonymous sessions, with heatmap functionality available at both the individual video and viewer level. Knowing that a specific viewer rewatched your pricing walkthrough three times is a conversion signal. Knowing that a section performs well on average is simply content feedback.
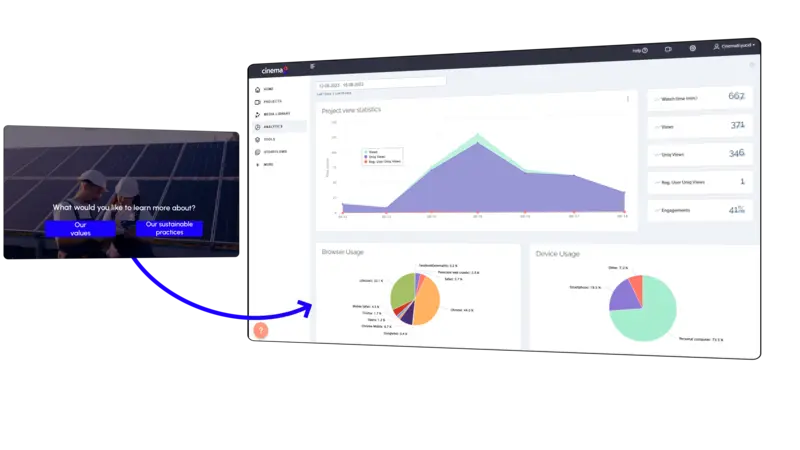
Video engagement data should also flow directly into your CRM so that conversion signals can trigger automated workflows, update lead scores, or notify sales teams in real time. Without this integration, even the strongest behavioural signals remain isolated in your video platform and never influence follow-up. Session-level reporting is equally important, giving your team visibility into what a viewer watched across an entire session.
Cinema8's video hosting platform combines viewer-level analytics, heatmap tracking, and CRM-ready integrations, giving marketing teams the data infrastructure needed to turn video engagement into measurable conversion intelligence.
Video analytics metrics and conversion potential: key takeaways
Understanding which video analytics metrics predict conversion potential is only valuable when those signals are being captured, combined, and acted on. Watch depth, return viewing frequency, heatmap engagement, in-video interaction rate, and multi-video consumption patterns each contribute to a clearer picture of purchase readiness. Read together, they form a conversion fingerprint that is considerably more reliable than any individual metric reviewed in isolation.
The marketing teams that gain the most from video analytics are those who treat viewer behaviour as a structured source of commercial intelligence. That shift starts with the right platform infrastructure and a clear understanding of which signals matter most at each stage of the funnel.
For teams looking to identify conversion potential earlier and with greater accuracy, Cinema8's video hosting platform provides the viewer-level analytics, heatmap tracking, and CRM integrations needed to put these metrics to work. Explore Cinema8's analytics capabilities or sign up today to see how your video engagement data can become a reliable predictor of conversion potential.