
Heatmap analytics for videos
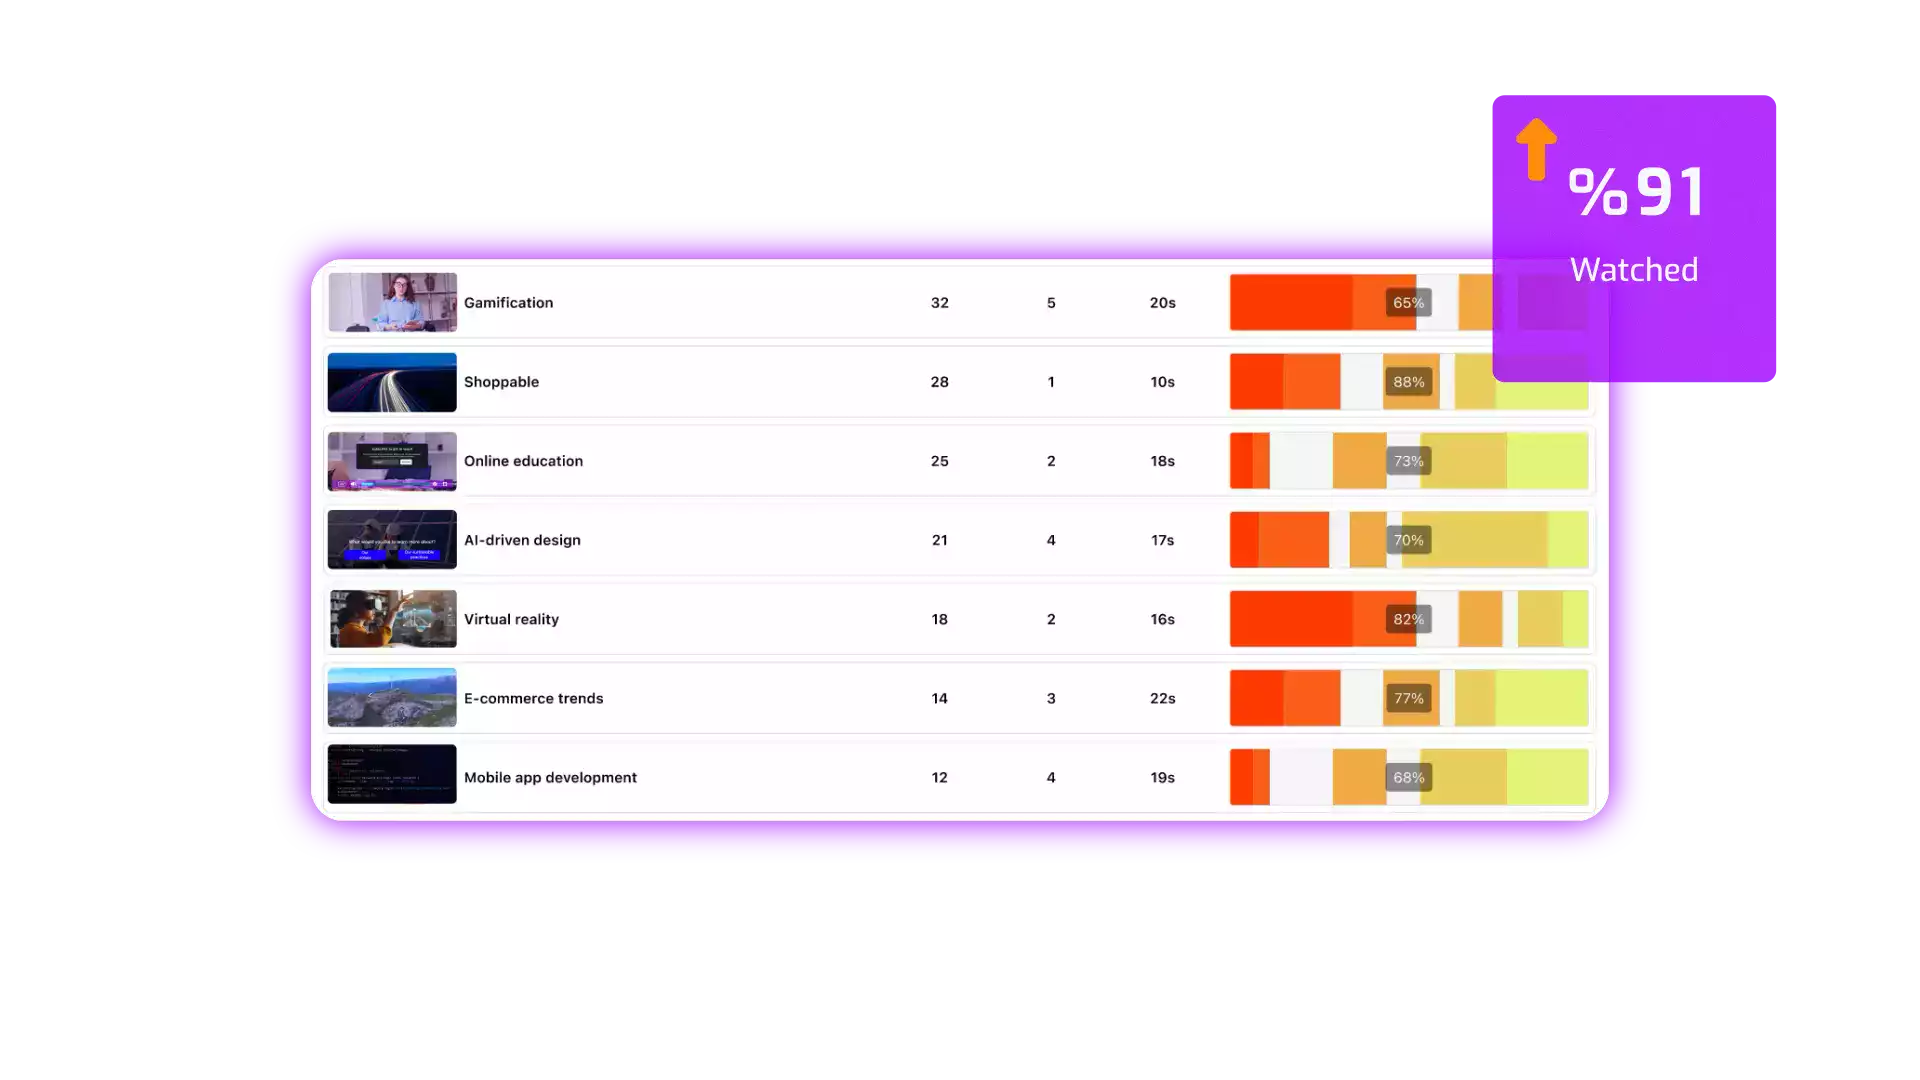
Cinema8’s heatmap analytics show exactly how viewers interact with your videos. Track where audiences click, pause, or stop watching to identify which sections capture attention and which lose interest. With colour-coded engagement maps, you can analyse performance across campaigns, compare results, and make data-backed edits that improve retention, storytelling, and overall video impact.
Trusted by leading brands around the world


Cinema8’s video analytics suite includes powerful heatmap visualisation tools that help you see how viewers interact with every part of your video. Each heatmap highlights where audiences pause, replay, or drop off, giving you an instant understanding of what captures attention. Whether you’re optimising marketing content, training materials, or product demos, Cinema8 helps you refine your storytelling based on real audience engagement patterns.
How to use heatmap analytics in Cinema8
Discover which parts of your videos attract attention, encourage interaction, or cause drop-offs using Cinema8’s visual heatmap analytics.
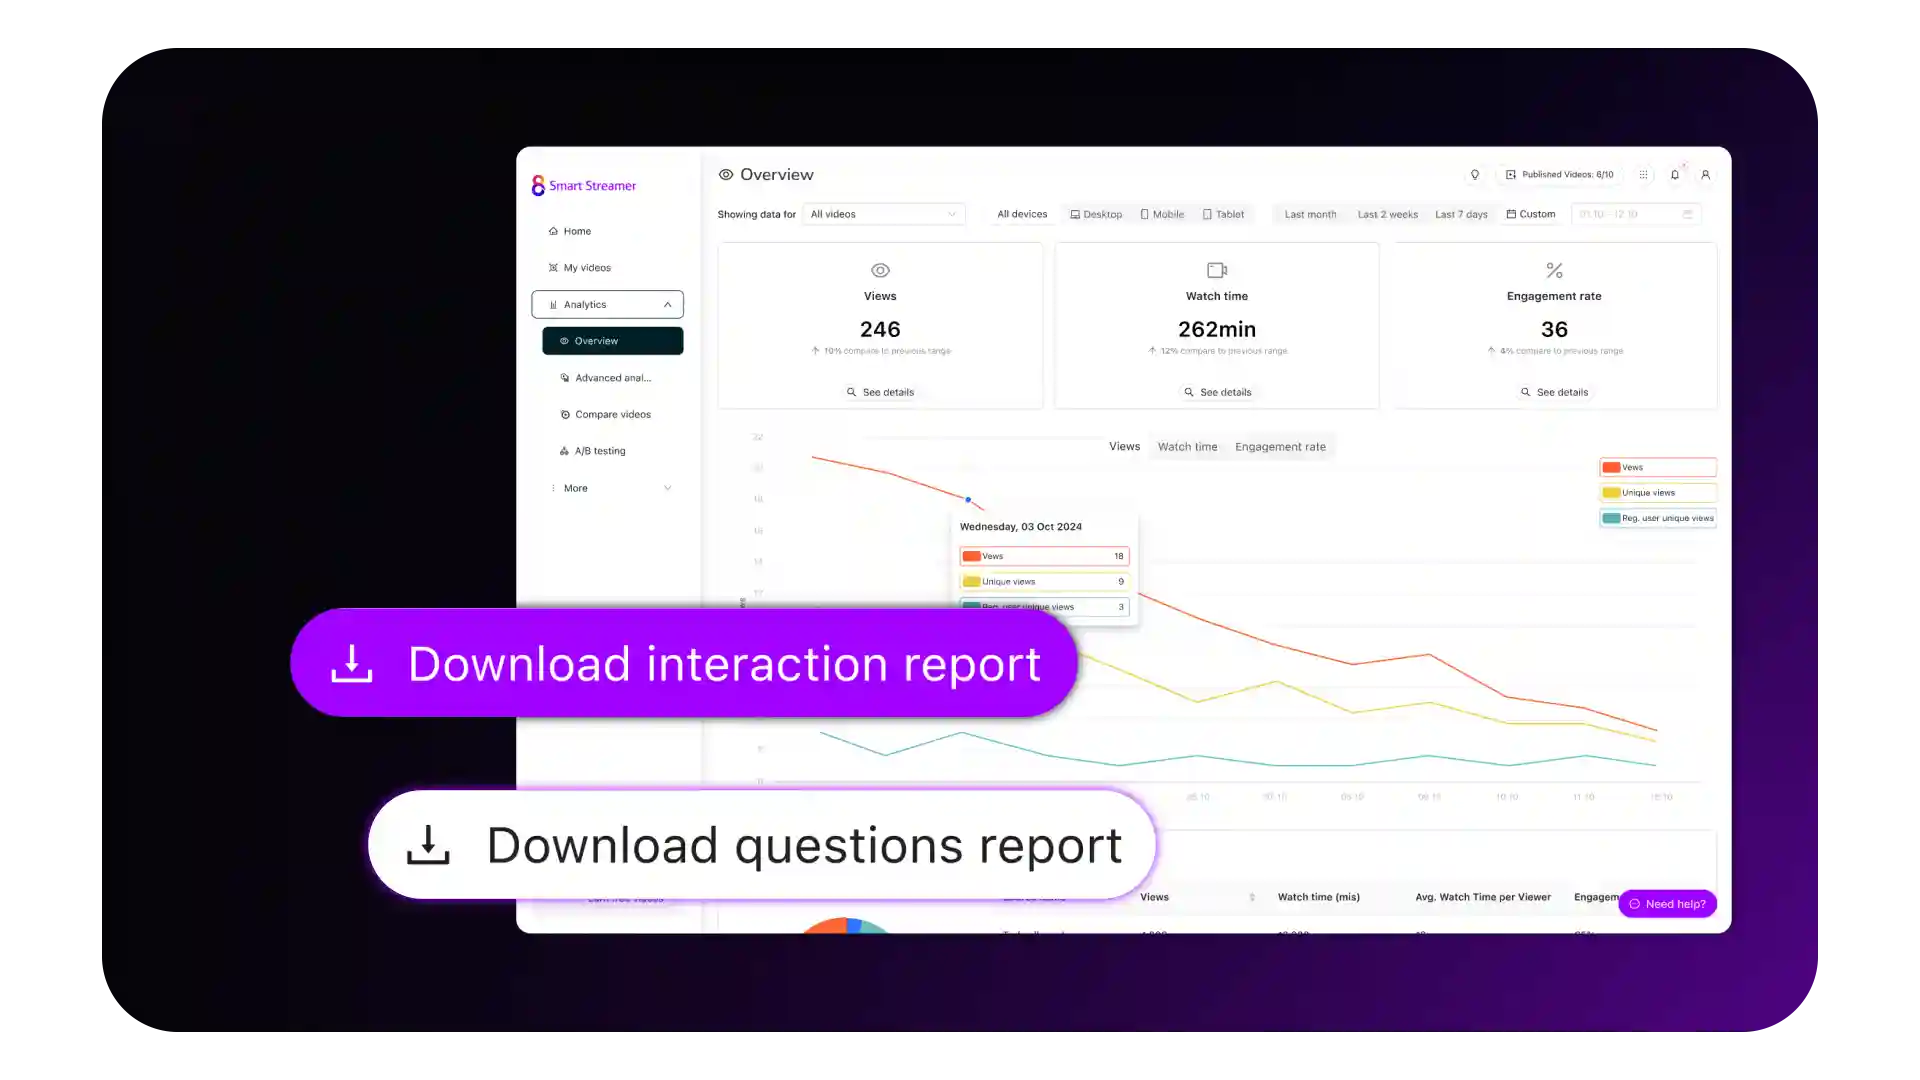
Upload or select your hosted videos in Cinema8. The platform automatically tracks engagement and generates colour-coded heatmaps showing where viewers click, pause, replay, or exit.
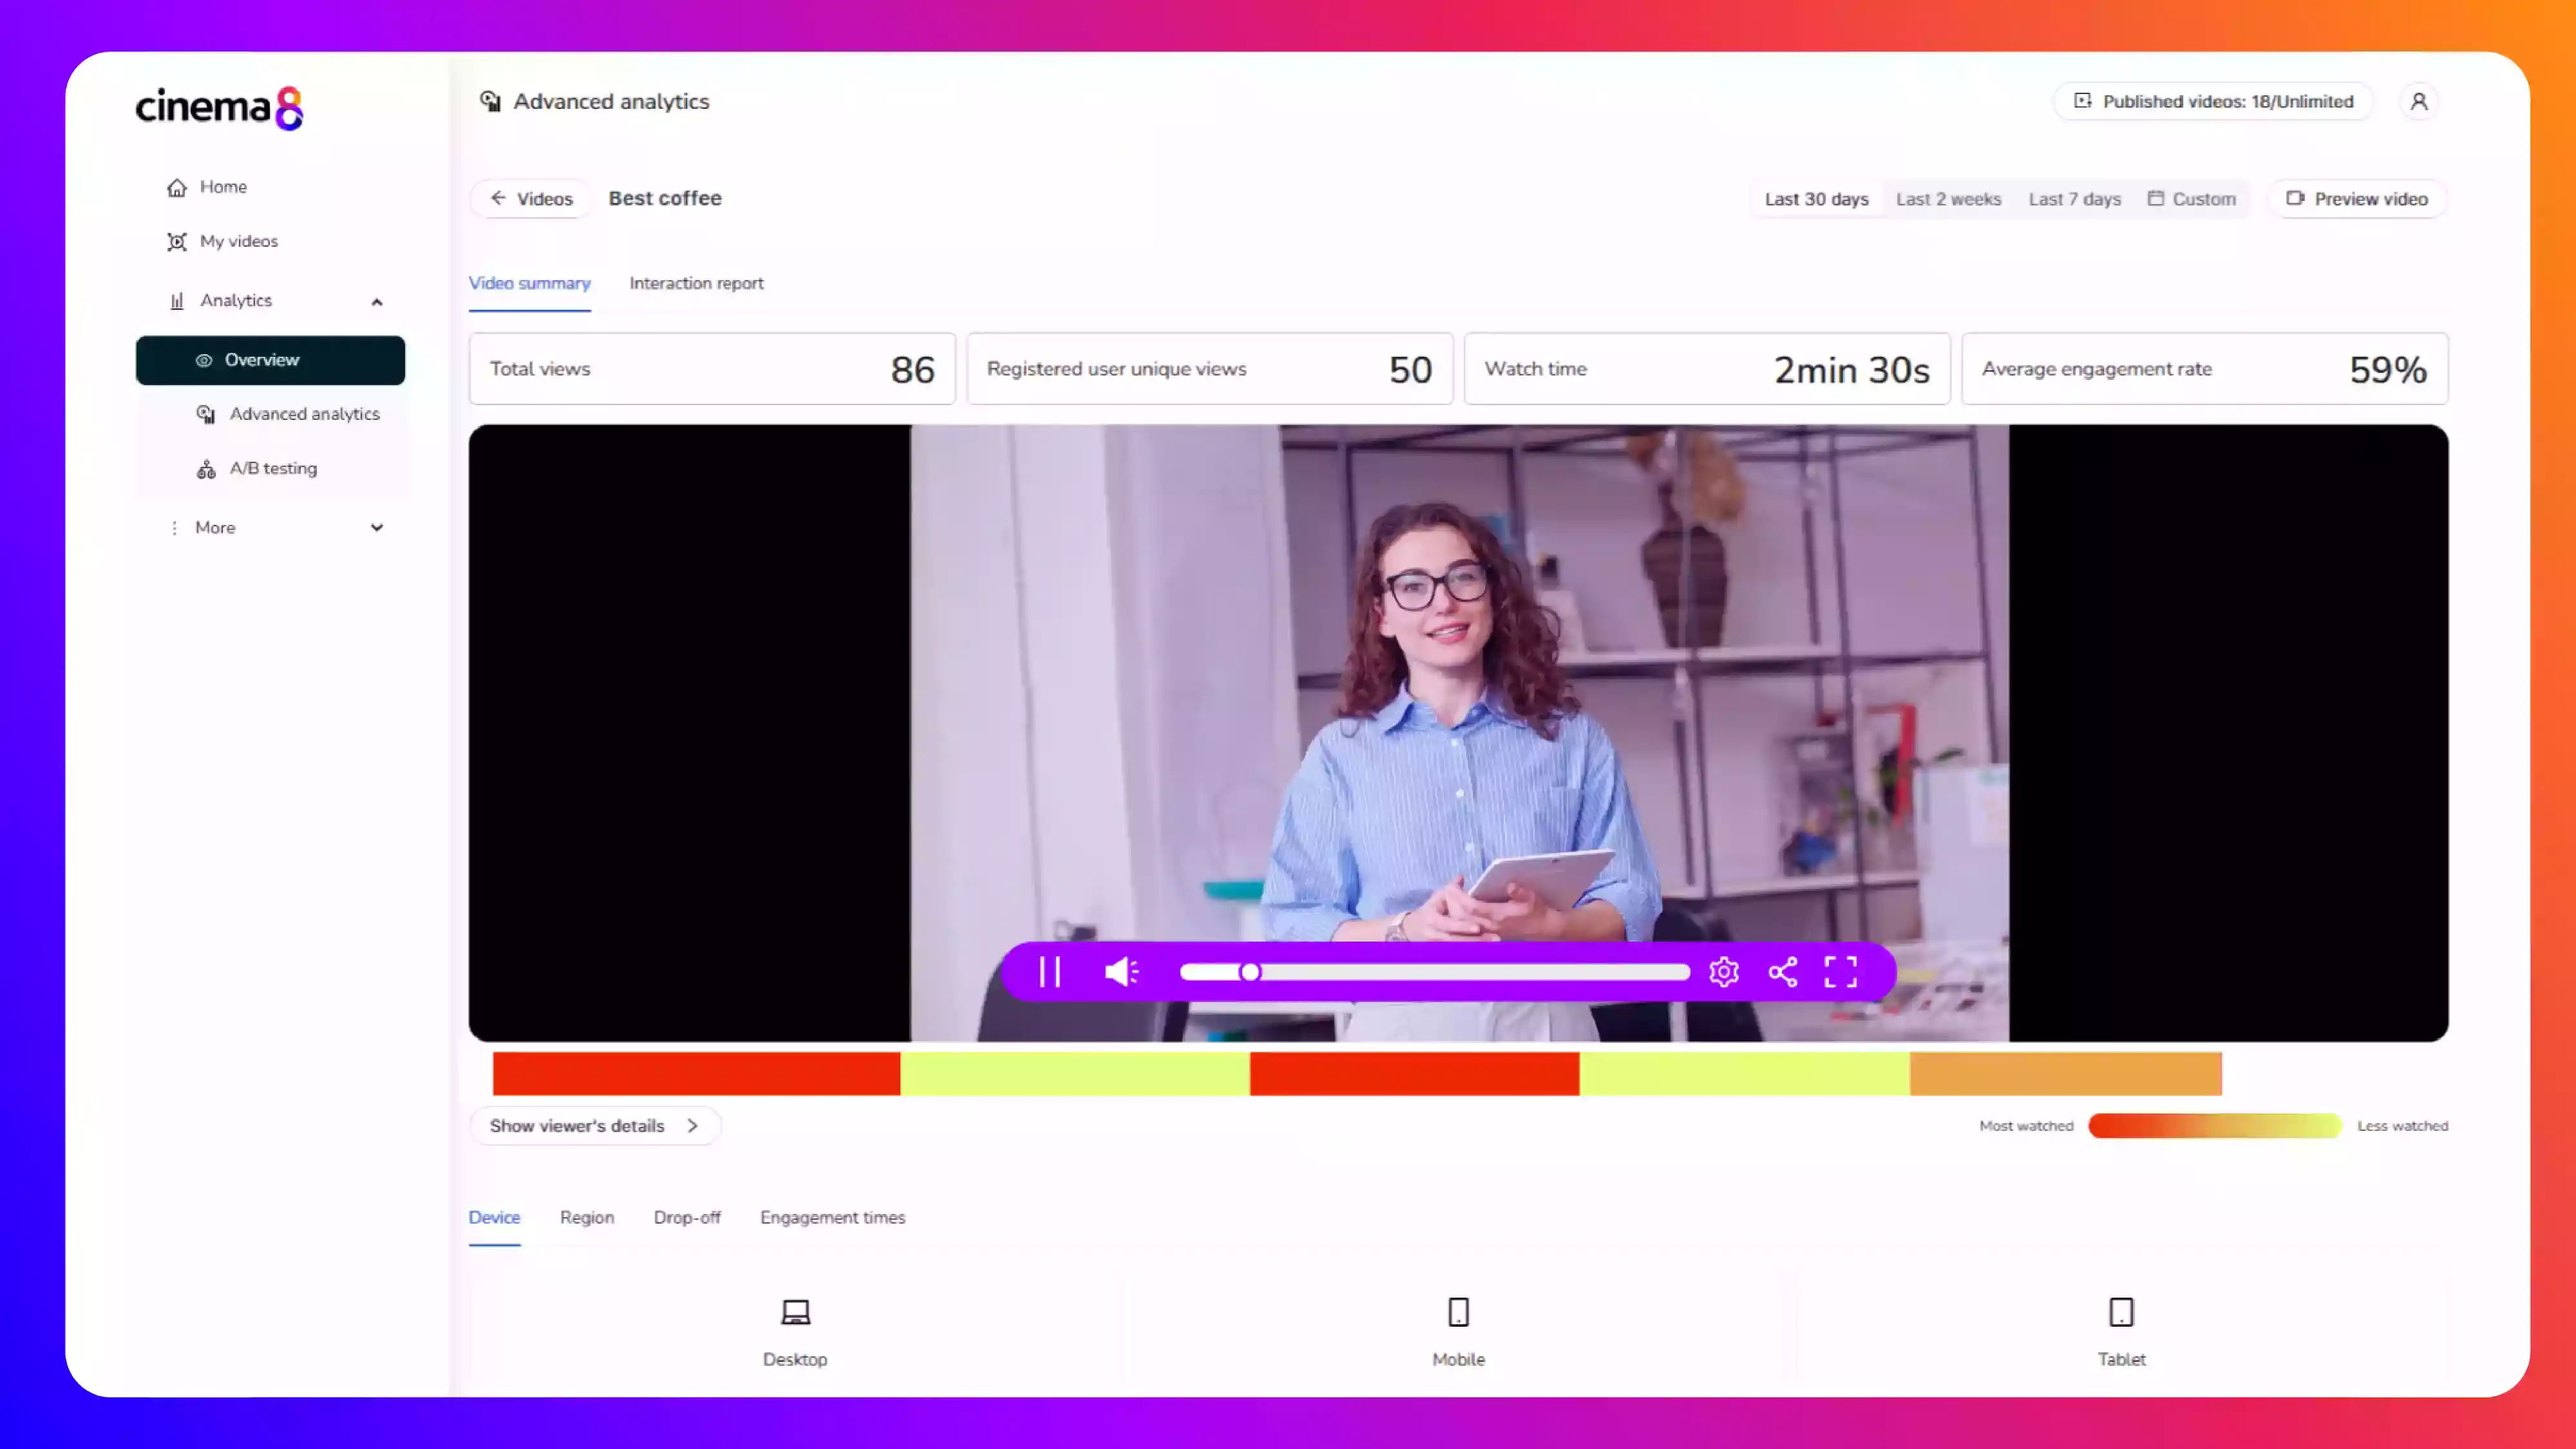
Open the heatmap view to explore engagement data. Each colour indicates viewer behaviour. Warmer tones reveal high interest, while cooler areas highlight segments that lose attention.
Use these insights to edit or reposition your content. Adjust pacing, visual cues, or calls to action to create more engaging and effective videos.
Why use Cinema8’s heatmap analytics?
Cinema8’s heatmap analytics help teams understand exactly how viewers interact with their videos, forming a clear foundation for effective B2B video engagement strategies. By visualising engagement moment by moment, you can see which sections capture attention and which may need improvement. These insights allow marketers, educators, and enterprise teams to refine content structure, strengthen storytelling, and increase overall viewer retention and satisfaction.
How Cinema8 improves video performance with heatmaps
Visualise viewer engagement with colour-coded attention maps
Identify where audiences lose interest or replay sections
Use insights to refine pacing, structure, and key messaging
Cinema8’s heatmaps show exactly which moments capture audience attention. Identify high-performing sections, refine pacing, and reposition CTAs for maximum impact. Use these insights to optimise ad content, explainer videos, or campaigns that rely on strong viewer engagement.
Corporate teams can use heatmaps to see how employees engage with internal updates or town halls. Measure attention patterns across departments, identify drop-off points, and refine video length, delivery, and structure for more effective company-wide communication.
Training and HR teams can use heatmap analytics to understand how employees interact with learning videos. See where participants pause, replay, or skip, and adjust lesson flow or clarity to keep learners engaged and improve retention across all training materials.
See why other teams use Cinema8’s tools understand viewer behaviour and make every video perform better.
During travel restrictions, Cinema8 proved valuable as a tool. Its platform offered straightforward yet complete tools, allowing us to give virtual demonstrations of our solutions in a secure and efficient way.
Jay Yalung
Art Director, Marketing and E-Commerce / Leica Geosystems
Cinema8 software engaged and motivated students with 360-degree videos at the Tate Gallery, featuring past student projects. Staff support was responsive and helpful with training. A valuable tool for educational institutions.
Chi-Ming Tan
Unit Lead Lecturer LCCA / London College of Contemporary Arts
Cinema8 has been instrumental in compiling all of the videos for a research project on employment for the blind or visually impaired, by offering an easy-to-use web-based platform for building Interactive Videos.
Sarah Moody
Communications Coordinator / Mississippi State University
Cinema8 was chosen for its ease of use and ability to create interactive videos through an intuitive interface. The team received great support and reasonable pricing. leading to a renewal of their partnership. Cinema8's support helped them meet project deadlines.
Michel Sohel
Media Consultant / Eastern Michigan University
Starter
$12
per month billed annually
Everything in Free, plus:
- Lead gen forms with CRM/email integration
- 360 degree interactive video support
- Unlimited screen recording
- Customisable video player
- 1TB bandwidth
Recommended
Pro
$24
per month billed annually
Everything in Starter, plus:
- Sticky hotspots for moving objects
- AI chaptering + SEO metadata
- AI-powered speech search
- Video heatmaps + advanced reports
- 2TB bandwidth
Pro Plus
$84
per month billed annually
Everything in Pro, plus:
- FTP upload for video libraries
- Webhook-based event notifications
- Domain restriction
- Priority + dedicated support
- Unlimited seats