
Advanced analytics dashboard for managers
Cinema8's video hosting platform provides managers with an advanced analytics dashboard that turns video performance data into clear, actionable insight. Managers get a streamlined view of engagement trends, completion rates, and performance summaries across teams or initiatives. This high-level visibility helps leaders understand what’s working, identify risks early, and make informed decisions without needing to analyse individual videos in detail.
Trusted by leading brands around the world


The Cinema8 video hosting platform's built-in video analytics tools include a consolidated dashboard so managers can oversee video performance across teams, departments, or initiatives. Instead of reviewing individual reports, managers can view engagement summaries, completion trends, and performance patterns in one place. This helps leaders understand how video content is being used, identify areas of risk or underperformance, and support teams with data-backed decisions. The dashboard is designed for clarity, making analytics accessible without requiring deep technical analysis.
How managers use Cinema8's analytics dashboard
Review performance summaries and engagement trends without analysing individual videos.
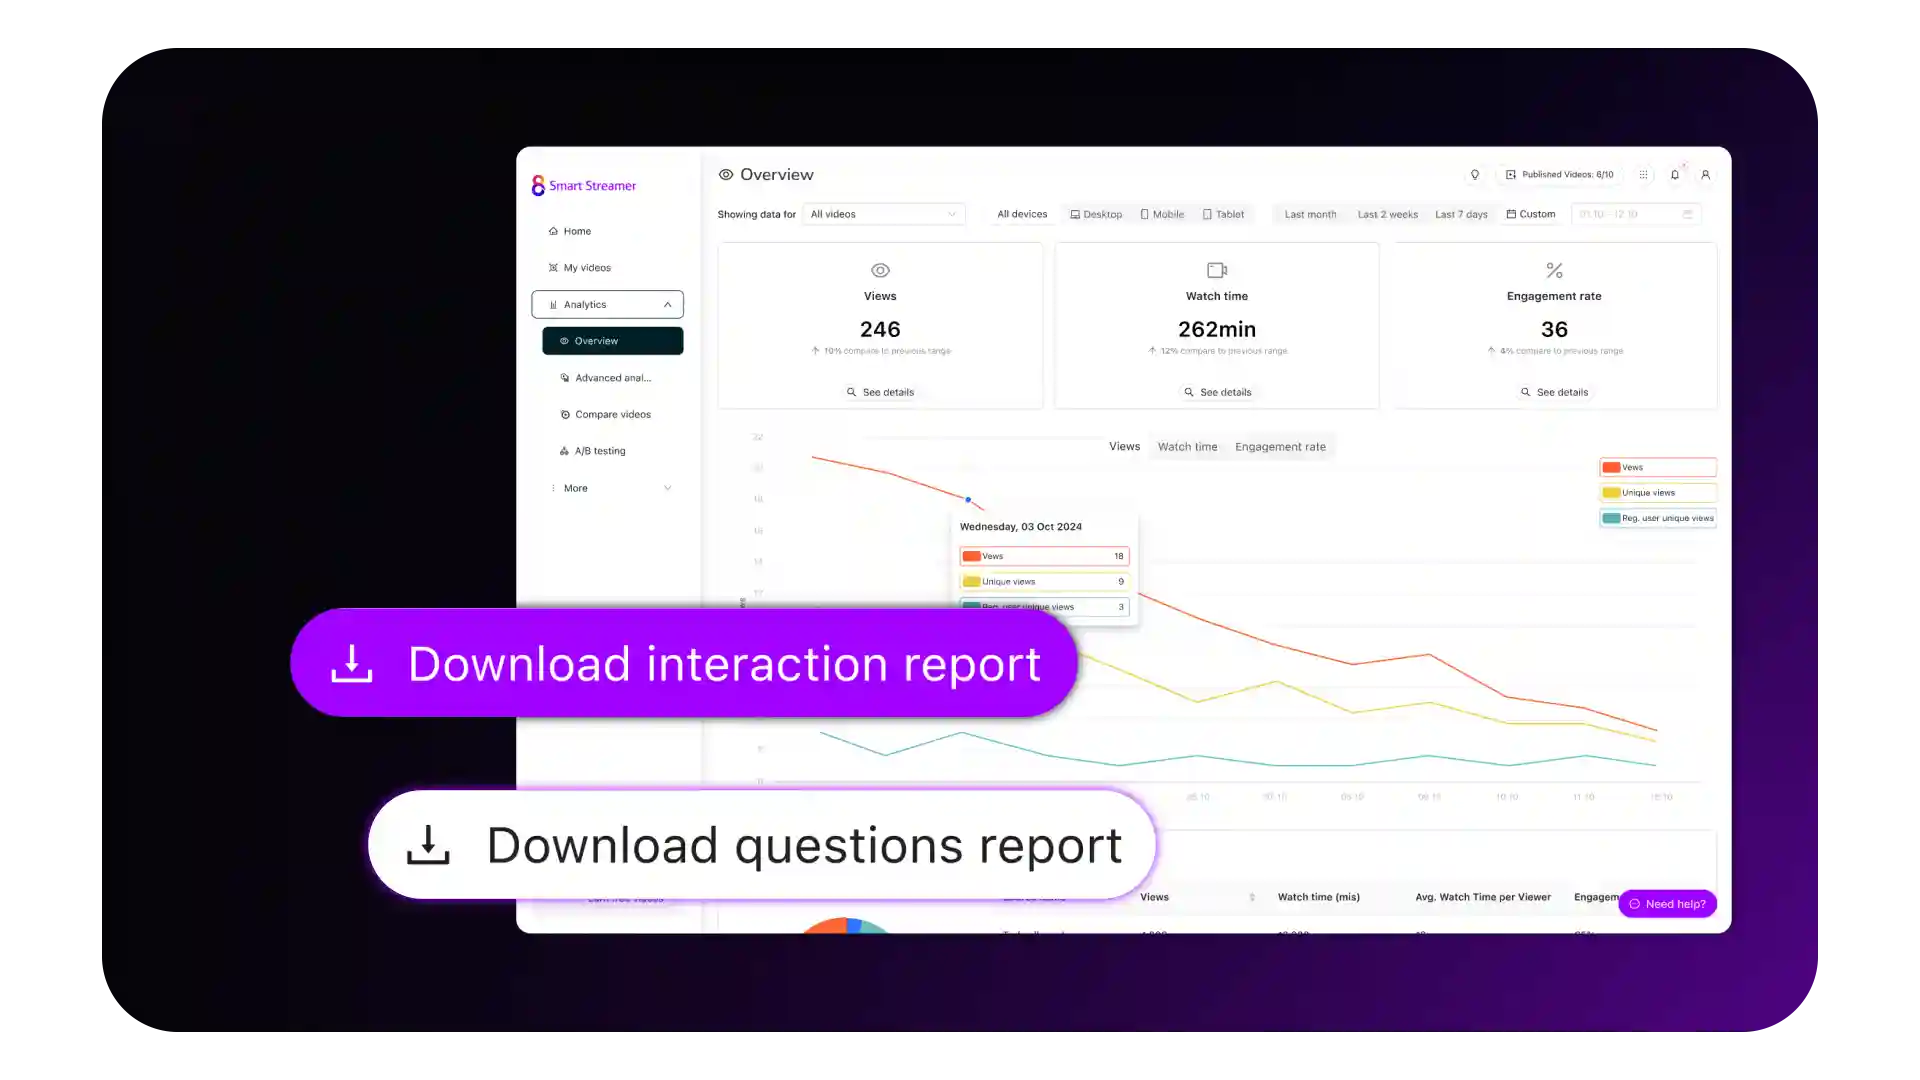
Login and access the Cinema8 analytics dashboard to view aggregated performance data across teams, campaigns, or content groups; displayed in a clear, manager-friendly format.
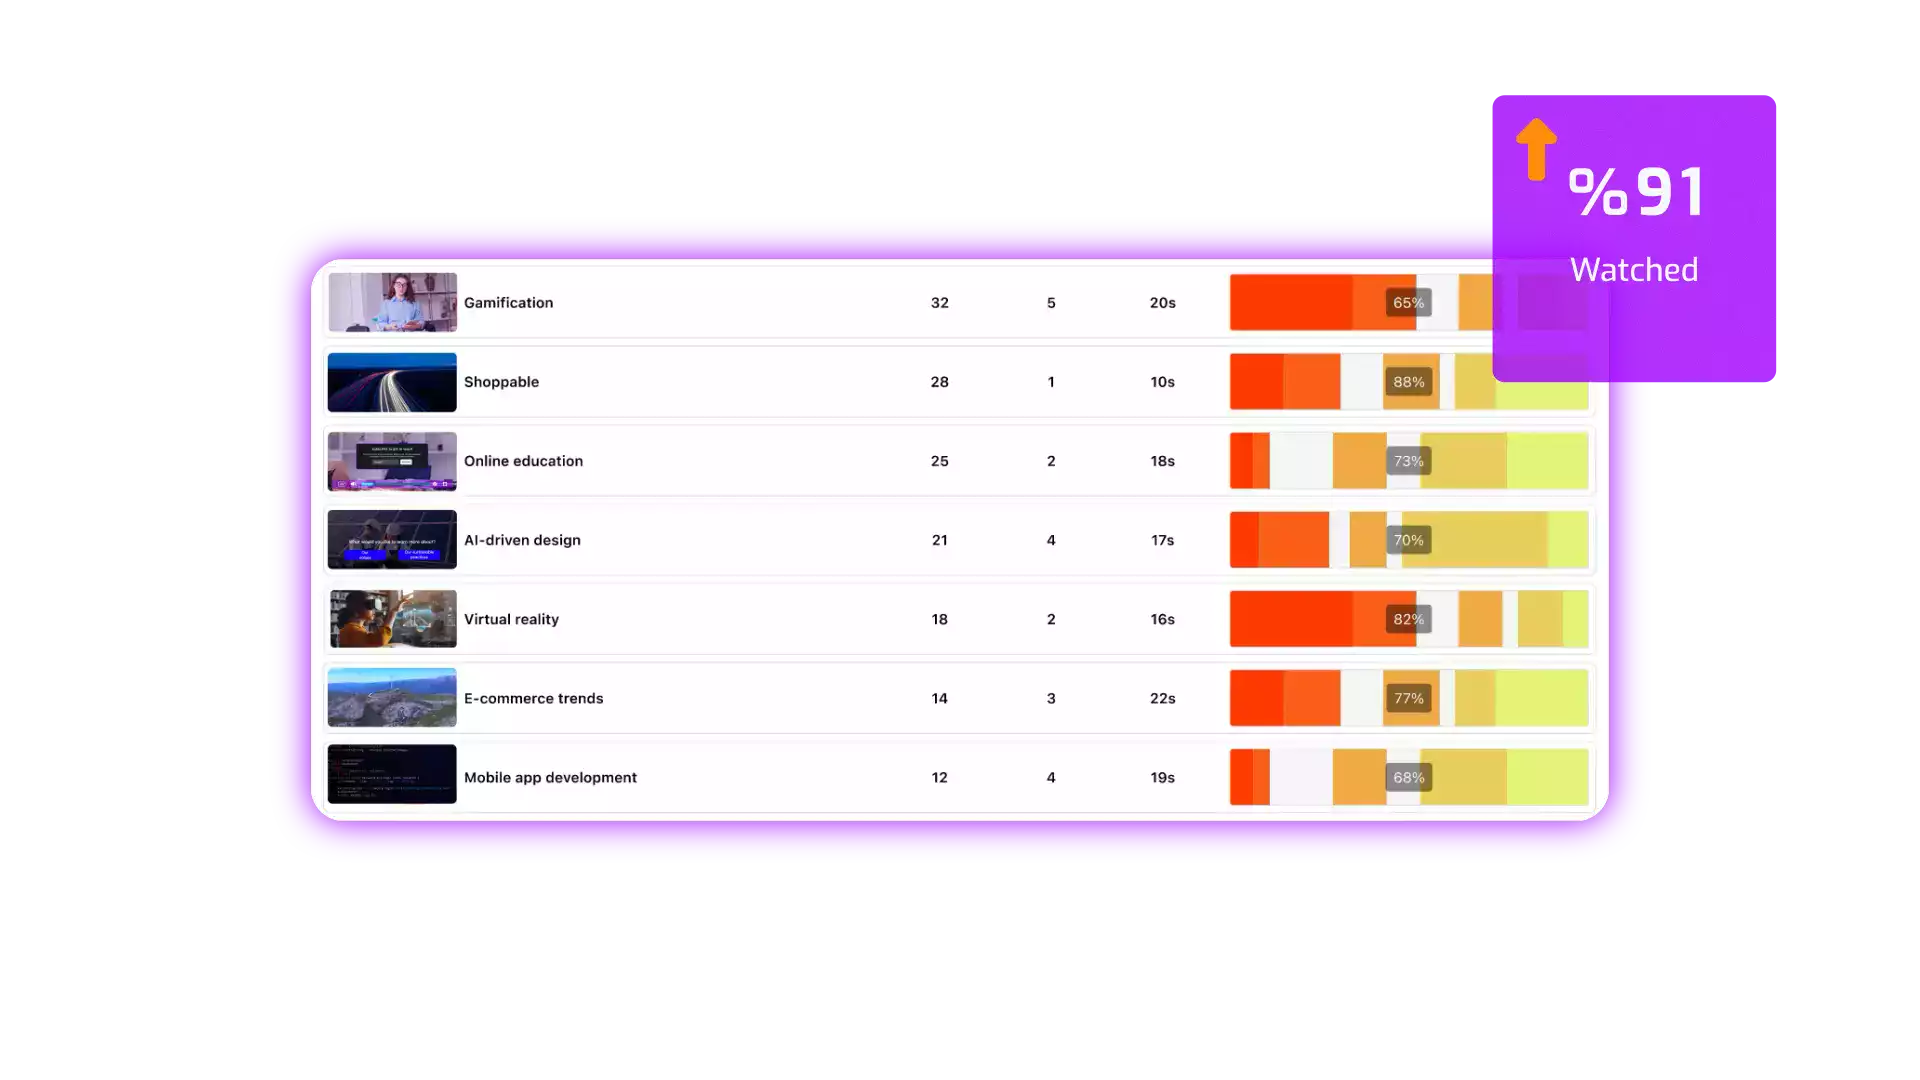
Review engagement trends, completion rates, and performance patterns to understand how video initiatives are progressing and to identify any emerging risks early.
Use the dashboard insights to support decisions, guide team priorities, or request improvements. Managers can act on data without needing to dig into raw analytics or individual video reports.
Why use Cinema8’s analytics dashboard for managers?
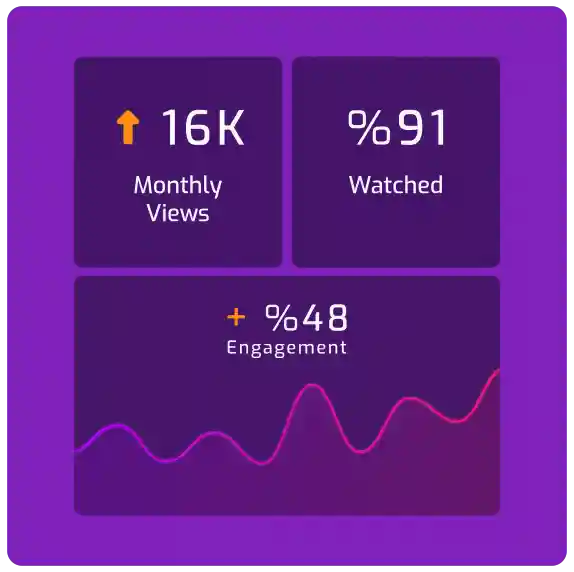
Cinema8's analytics tools give managers a clear, consolidated view of video performance without overwhelming them with raw data. By presenting engagement trends, completion summaries, and high-level insights in one dashboard, leaders can understand progress quickly, identify issues early, and support teams with informed guidance. This reduces reporting friction and helps managers stay aligned with outcomes rather than metrics alone.
How Cinema8 supports managers with advanced analytics dashboards
View performance trends across teams without reviewing raw data
Identify risks or underperformance early with aggregated insights
Support better decisions using clear, manager-level reporting
Department heads can use the analytics dashboard to compare engagement and completion trends across different teams or functions in real time. This high-level visibility helps managers identify which teams are performing well and where additional employee support or alignment may be needed.
Managers responsible for organisation-wide initiatives can monitor how key video programmes perform over time. Aggregated analytics make it easier to assess adoption, spot declining engagement, and validate whether strategic objectives are being met.
During leadership reviews or other performance reviews, managers can reference dashboard insights to support discussions with clear evidence. Engagement trends and completion summaries provide context for outcomes without relying on anecdotal feedback or manual reporting.
See how managers use Cinema8 dashboards to gain clarity and guide better decisions.
During travel restrictions, Cinema8 proved valuable as a tool. Its platform offered straightforward yet complete tools, allowing us to give virtual demonstrations of our solutions in a secure and efficient way.
Jay Yalung
Art Director, Marketing and E-Commerce / Leica Geosystems
Cinema8 software engaged and motivated students with 360-degree videos at the Tate Gallery, featuring past student projects. Staff support was responsive and helpful with training. A valuable tool for educational institutions.
Chi-Ming Tan
Unit Lead Lecturer LCCA / London College of Contemporary Arts
Cinema8 has been instrumental in compiling all of the videos for a research project on employment for the blind or visually impaired, by offering an easy-to-use web-based platform for building Interactive Videos.
Sarah Moody
Communications Coordinator / Mississippi State University
Cinema8 was chosen for its ease of use and ability to create interactive videos through an intuitive interface. The team received great support and reasonable pricing. leading to a renewal of their partnership. Cinema8's support helped them meet project deadlines.
Michel Sohel
Media Consultant / Eastern Michigan University
Starter
$12
per month billed annually
Everything in Free, plus:
- Lead gen forms with CRM/email integration
- 360 degree interactive video support
- Unlimited screen recording
- Customisable video player
- 1TB bandwidth
Recommended
Pro
$24
per month billed annually
Everything in Starter, plus:
- Sticky hotspots for moving objects
- AI chaptering + SEO metadata
- AI-powered speech search
- Video heatmaps + advanced reports
- 2TB bandwidth
Pro Plus
$84
per month billed annually
Everything in Pro, plus:
- FTP upload for video libraries
- Webhook-based event notifications
- Domain restriction
- Priority + dedicated support
- Unlimited seats