
Analytics for interactive video
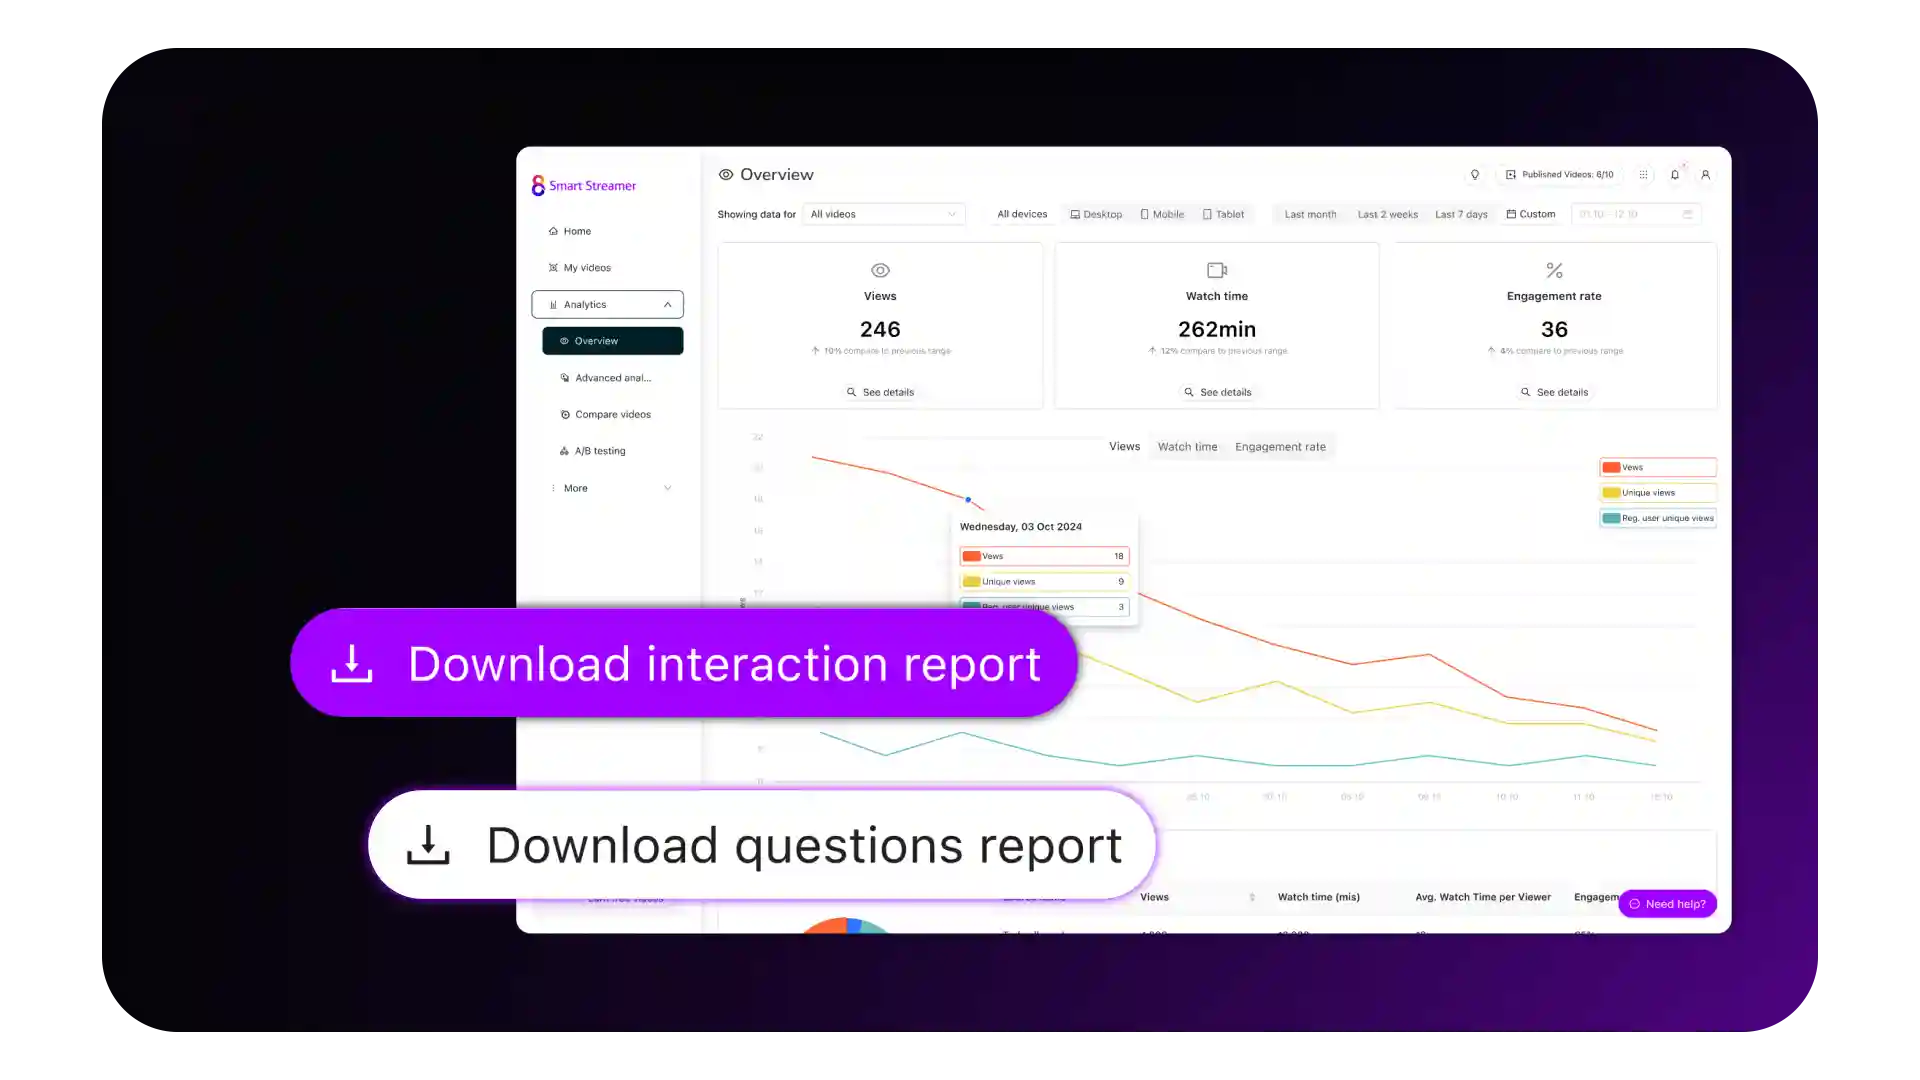
Understand exactly how viewers engage with your interactive videos using Cinema8’s advanced analytics. Go beyond views to track clicks on hotspots, poll responses, quiz results, and branching paths. Identify where audiences stop watching, see which choices they make, and measure completion rates. Export data into your CRM or analytics tools for actionable insights that improve training, marketing, and storytelling strategies.
Trusted by leading brands around the world


Combine Cinema8’s interactive video tools with advanced analytics to get a deeper understanding of audience behaviour. Measure clicks on hotspots, poll participation, quiz scores, and the exact paths viewers take through branching storylines. Completion rates and drop-off points reveal how engaging your videos truly are, while exports to CSV, CRM, or BI tools turn insights into measurable actions. With Cinema8, every interaction becomes valuable data to refine your video strategy.
How to track interactive video analytics with Cinema8
Gain deeper insights into your videos by tracking clicks, paths, and completion rates with Cinema8’s analytics tools.
Upload your video to Cinema8 via the dashboard, bulk import, or API, then add interactive elements such as quizzes, hotspots, polls, or branching paths.
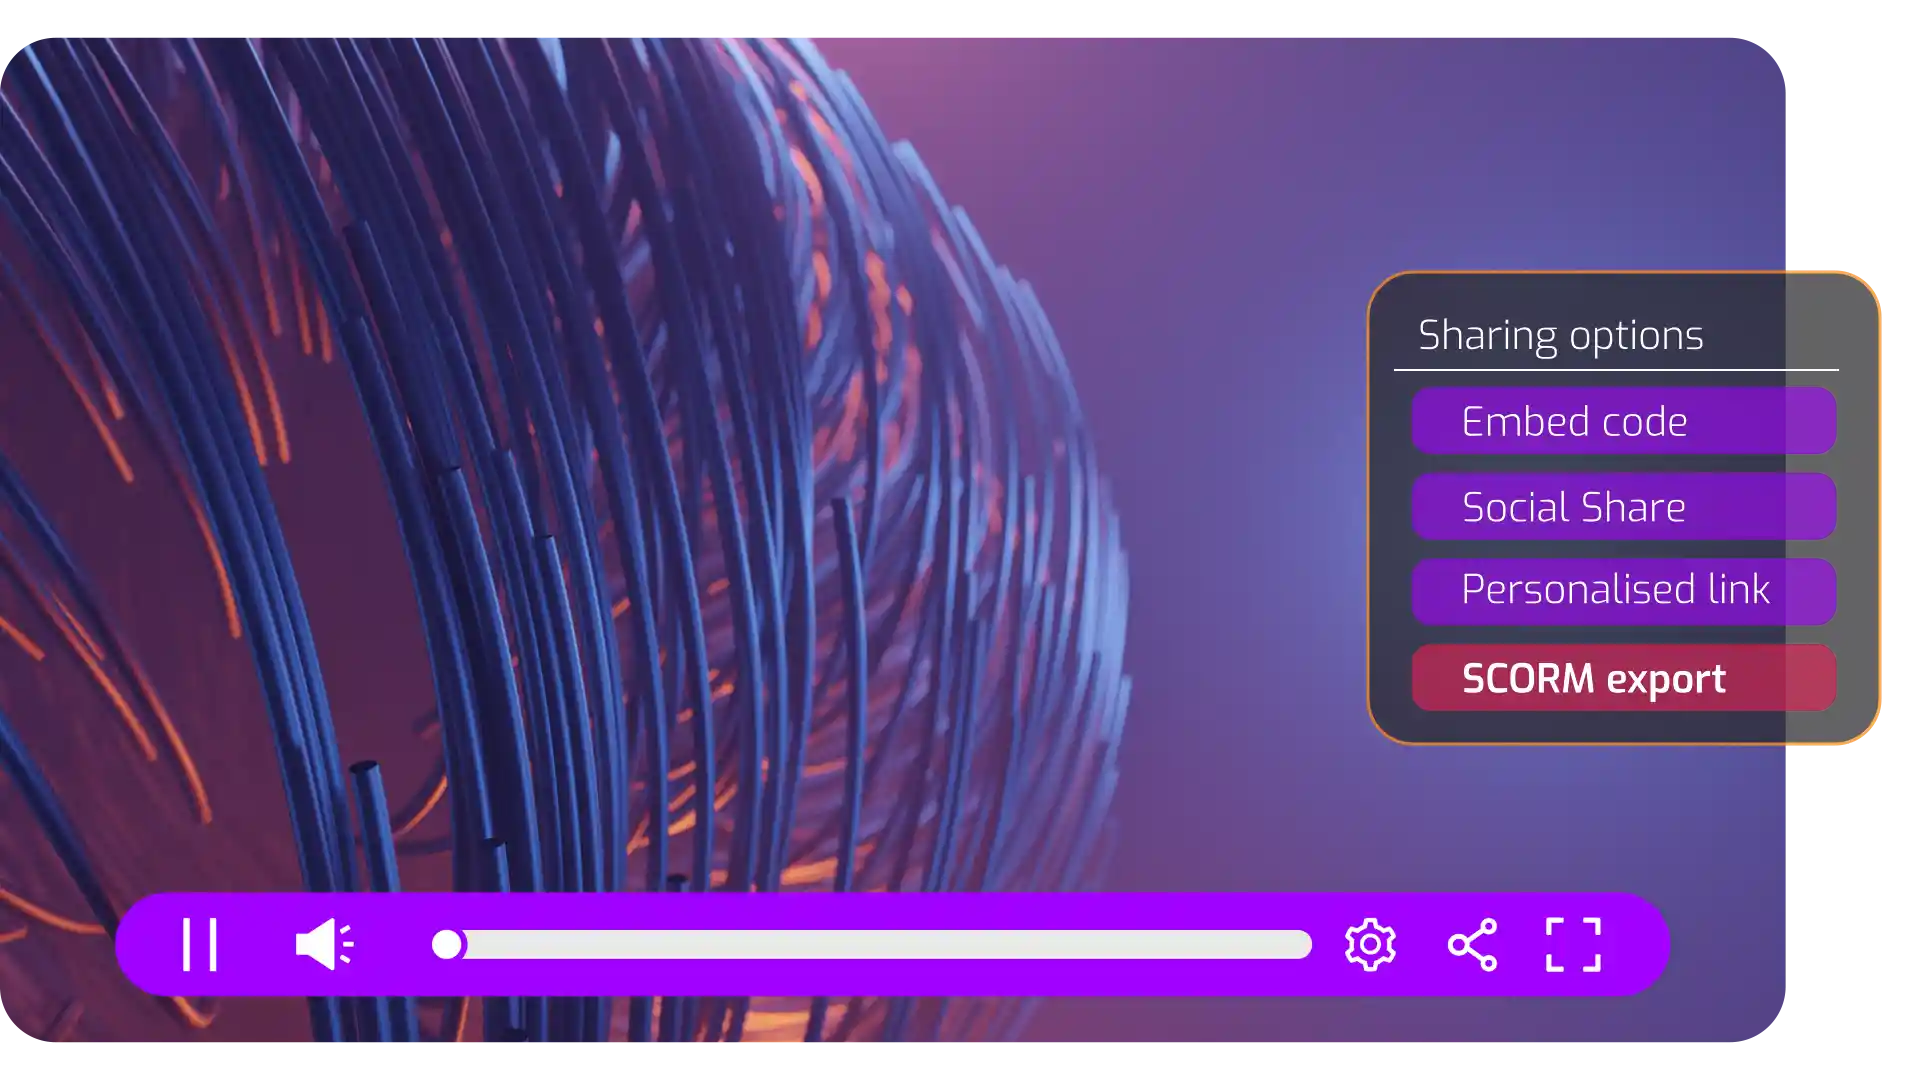
Launch your interactive video across websites, apps, or campaigns. Cinema8 tracks every click, response, and path viewers take in real time.
Review analytics in Cinema8’s dashboard or export data to CRM, LMS, or BI tools to optimise content and measure impact.
Why use Cinema8 for interactive video analytics?
Cinema8 provides detailed insights that go far beyond standard video metrics. Every interaction is tracked and visualised – whether it’s a click, quiz result, poll response, or branching decision. This allows you to see how audiences truly engage, where they lose interest, and which elements drive conversions or learning outcomes. With easy exports to CRM, LMS, or BI tools, your video data becomes instantly actionable.
How Cinema8 analytics enhance interactive video
Track clicks, polls, quizzes, and branching paths
Export engagement data to CRM, LMS, or BI tools
Identify drop-offs and optimise viewer experiences
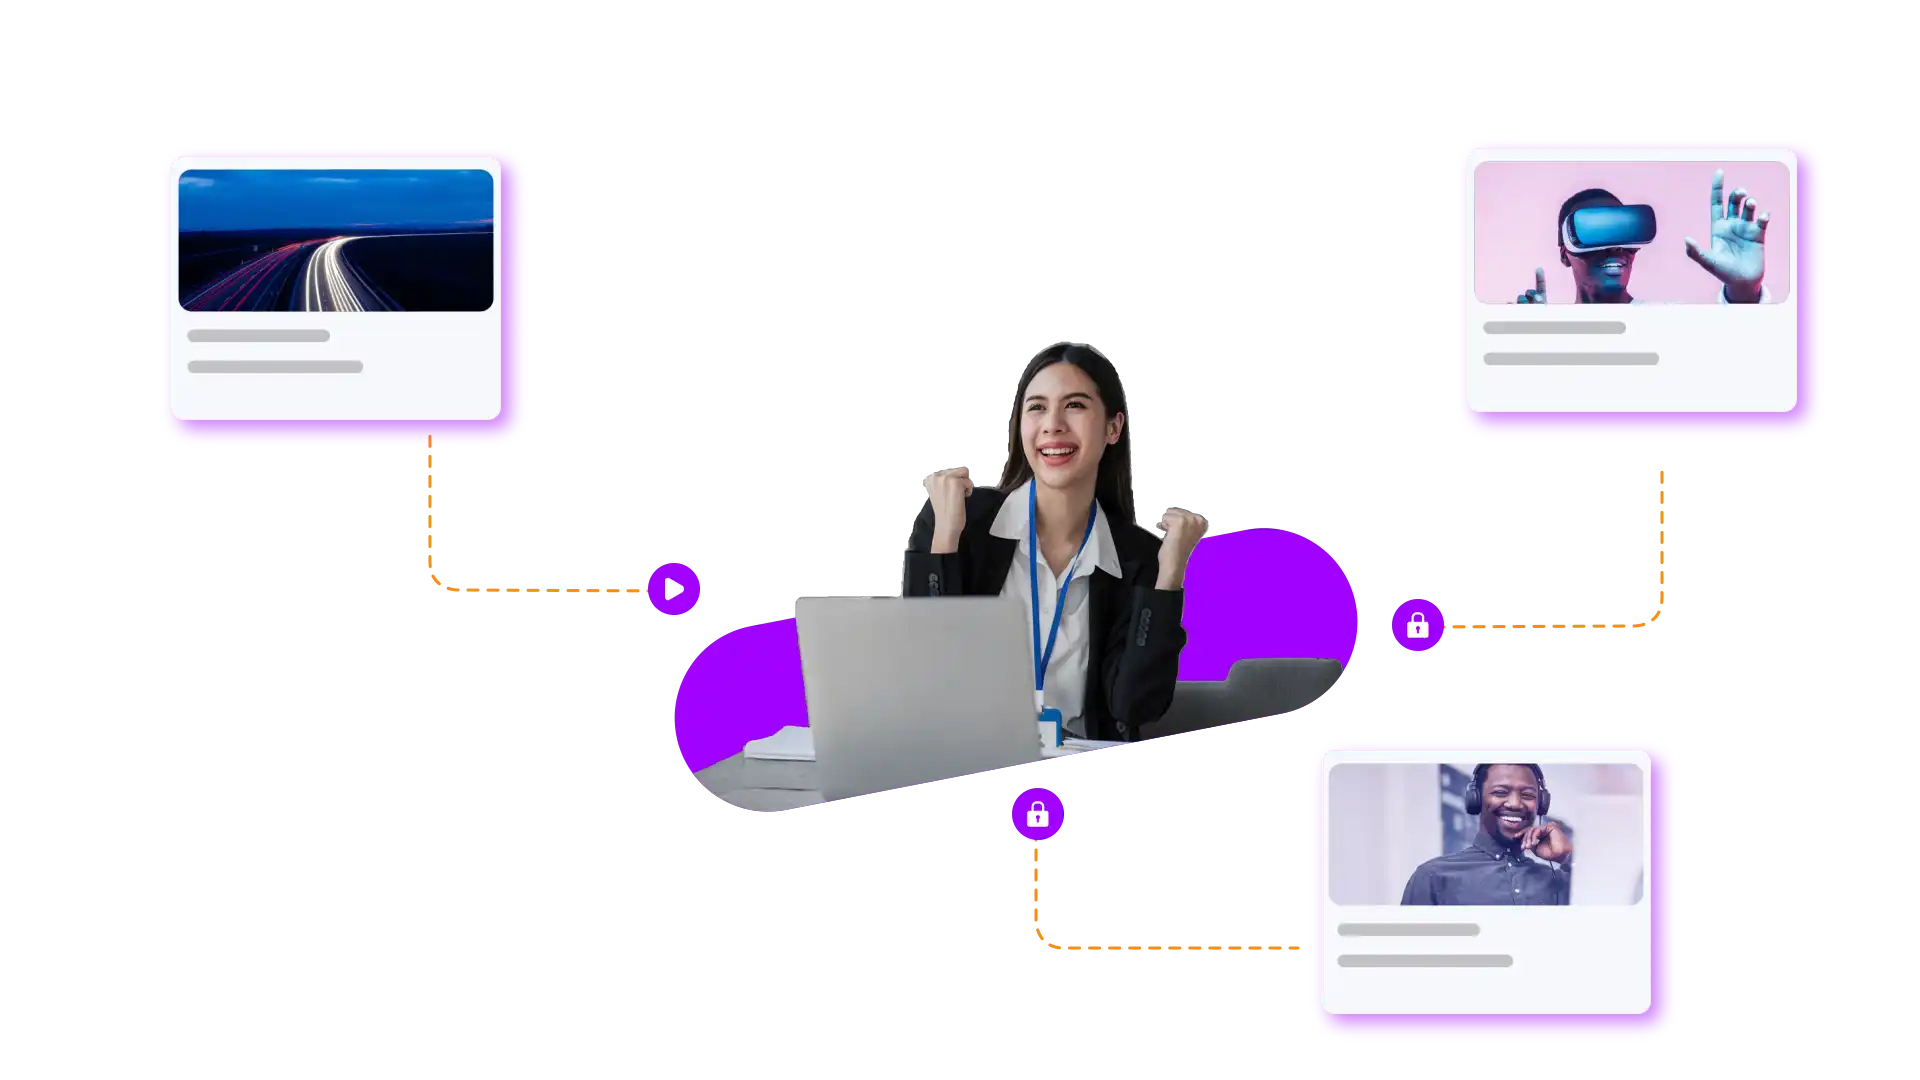
Track how audiences interact with CTAs, overlays, and branching paths in marketing videos. Use detailed analytics to measure conversions, identify drop-offs, and refine campaigns for stronger engagement and results.
Analyse quiz results, poll responses, and completion rates from interactive training videos. Export data to your LMS or business intelligence tools to evaluate employee learning outcomes and improve training strategies.
See which story branches viewers select in narrative videos. Analytics reveal audience preferences through interactive metrics, helping creators refine scripts and deliver more engaging, personalised storytelling experiences in future content.
Learn why organisations use Cinema8’s interactive video and analytics tools
During travel restrictions, Cinema8 proved valuable as a tool. Its platform offered straightforward yet complete tools, allowing us to give virtual demonstrations of our solutions in a secure and efficient way.
Jay Yalung
Art Director, Marketing and E-Commerce / Leica Geosystems
Cinema8 software engaged and motivated students with 360-degree videos at the Tate Gallery, featuring past student projects. Staff support was responsive and helpful with training. A valuable tool for educational institutions.
Chi-Ming Tan
Unit Lead Lecturer LCCA / London College of Contemporary Arts
Cinema8 has been instrumental in compiling all of the videos for a research project on employment for the blind or visually impaired, by offering an easy-to-use web-based platform for building Interactive Videos.
Sarah Moody
Communications Coordinator / Mississippi State University
Cinema8 was chosen for its ease of use and ability to create interactive videos through an intuitive interface. The team received great support and reasonable pricing. leading to a renewal of their partnership. Cinema8's support helped them meet project deadlines.
Michel Sohel
Media Consultant / Eastern Michigan University