What is an interactive video analytics dashboard?
An interactive video analytics dashboard is a visual interface that tracks how viewers interact with video content through metrics such as clicks, choices, completions, and conversions. It consolidates engagement data in real time, helping teams understand which parts of a video work, which lose attention, and how interactions translate into outcomes. By turning behaviour into visuals, dashboards make optimisation faster and decisions more data-driven.
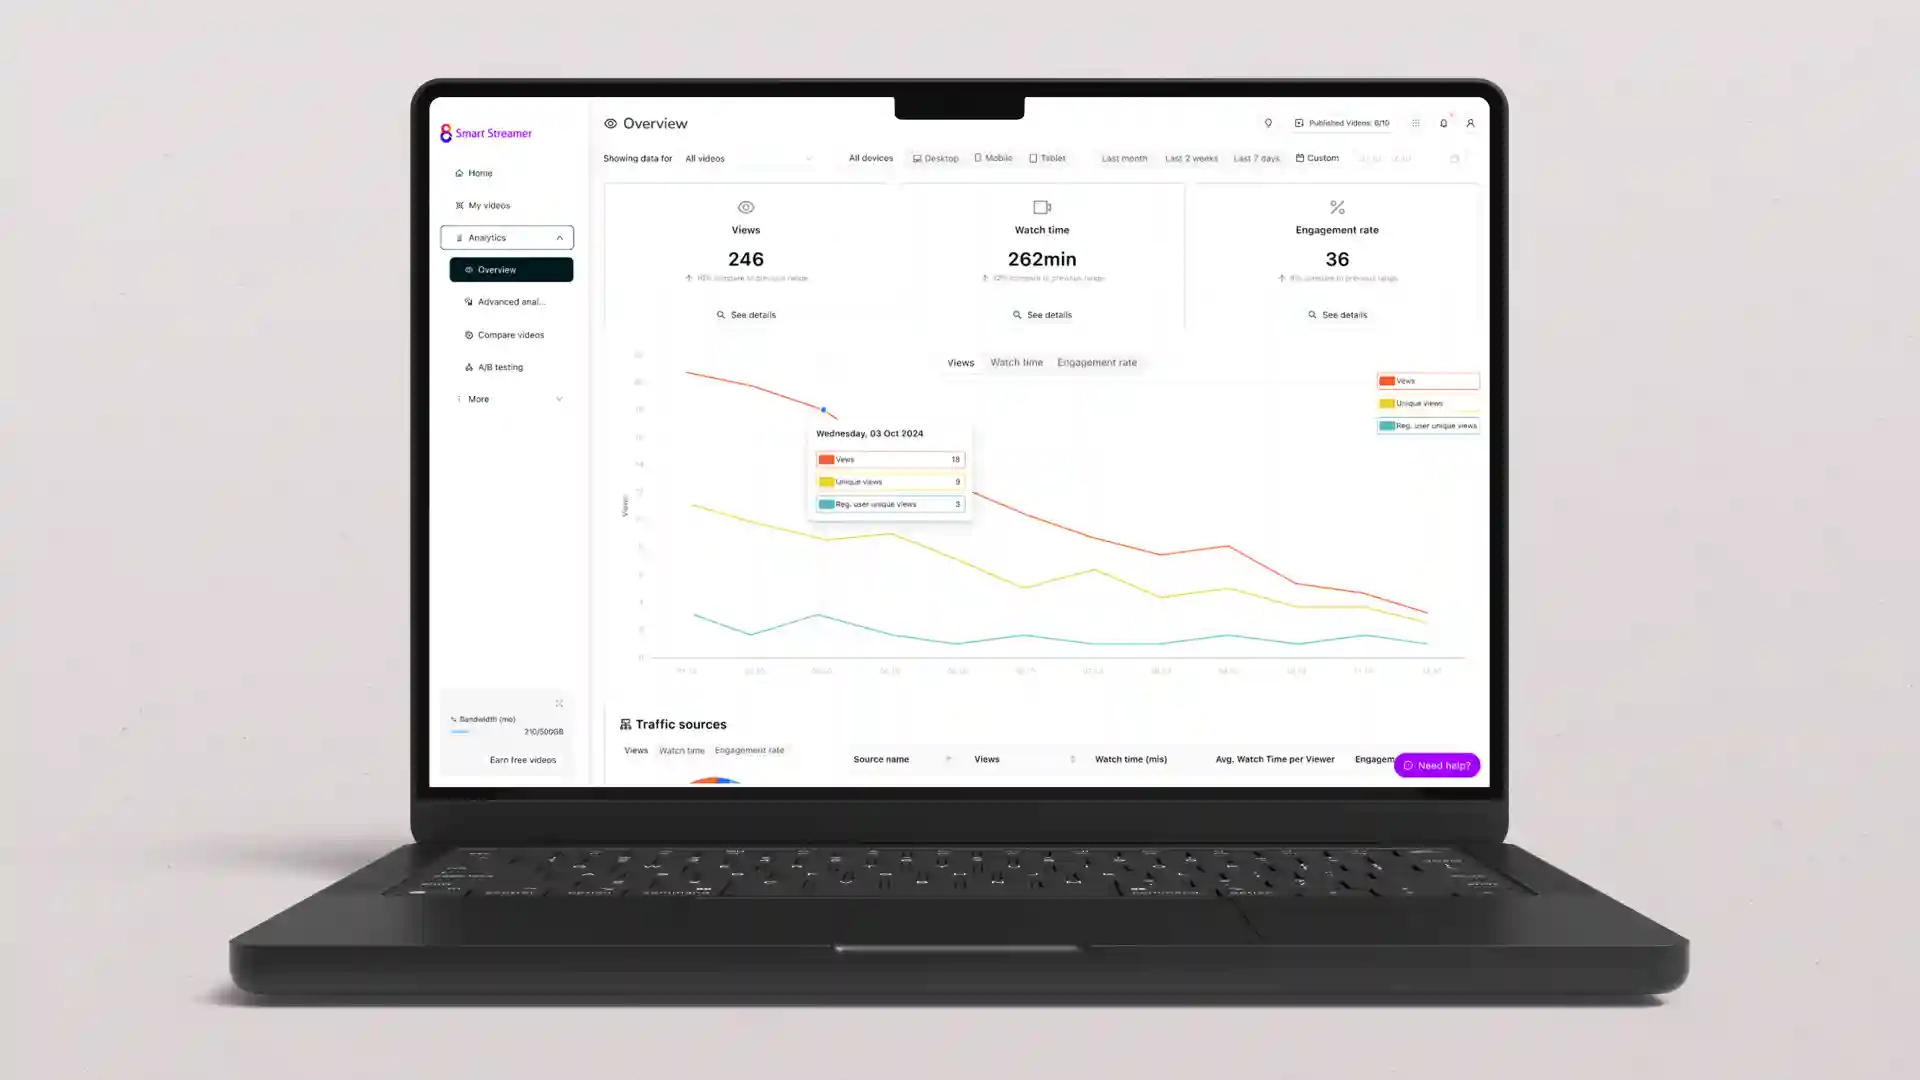
Definition of an interactive video analytics dashboard
An interactive video analytics dashboard collects and displays behavioural data from videos which are usually hosted on a dedicated video hosting platform. Common dashboard components include:
- Engagement metrics: Tracks plays, pauses, replays, and completions.
- Interaction data: Records clicks, form submissions, and quiz results.
- Heatmap visualisation: Highlights attention peaks and drop-off points.
- Conversion tracking: Measures how often viewers respond to CTAs.
- Comparative insights: Enables performance comparison across multiple videos.
Why does an interactive video analytics dashboard matter?
An interactive video analytics dashboard is important because it visualises how viewers behave inside video content that utilises interactive features. While traditional metrics show total views or average time spent, dashboards for interactive video reveal what users clicked, answered, or ignored. This behavioural visibility helps marketers identify high-performing elements, lets educators track comprehension, and gives brands the ability to link engagement directly to results.
What are the benefits of an interactive video analytics dashboard?
The benefits of interactive video analytics dashboards include real-time insights, actionable data, and improved strategy alignment. Real-time insights allow teams to spot trends as they happen, adapting campaigns or lessons quickly. Actionable data turns viewer behaviour into measurable learning or marketing outcomes. Improved alignment follows when creative, technical, and strategic teams share a single view of performance. Platforms featuring video analytics make this information accessible through clean, visual dashboards that reduce guesswork.
Applications of an interactive video analytics dashboard
Interactive video analytics dashboards are used across marketing, education, and corporate communication. Marketing teams measure which videos generate the most leads or CTA clicks. Educators monitor quiz results and completion rates to refine course content. Enterprises use dashboards to evaluate internal training engagement. Solutions like analytics for interactive video help you define which behaviours matter most by measuring common interactive video metrics.
How Cinema8 uses an interactive video analytics dashboard
Cinema8’s video hosting platform offers analytics support through its analytics dashboard; giving organisations complete visibility into how audiences engage with their videos. Every click, answer, or interaction is tracked and visualised through charts, heatmaps, and engagement flows. Teams can filter results by campaign, audience, or device, then connect insights to CRM or LMS tools for broader analysis. Cinema8's platform is designed for growth, and transforms interactive video analytics into actionable intelligence to improve storytelling, learning outcomes, and marketing performance.
Book a demo to see how Cinema8’s interactive video analytics dashboard helps you visualise audience behaviour, refine content, and measure real engagement.