What is heatmap analysis for video engagement?
Heatmap analysis for video engagement is a method of visualising how audiences interact with a video by highlighting the most and least watched sections. Instead of relying only on averages, heatmaps display where viewers pause, skip, or replay, giving a detailed picture of attention. This makes it easier to see which parts resonate and which need refinement, turning raw behaviour into actionable insights.
Definition of heatmap analysis for video engagement
Heatmap analysis for video engagement refers to visual data displays that map audience behaviour across a video timeline, and is offered by some advanced video hosting platforms. Common features include:
- Attention peaks: Highlights where viewers focus most heavily.
- Drop-off points: Shows where audiences stop watching or disengage.
- Replay zones: Identifies sections that are rewatched frequently.
- Click mapping: Records activity on hotspots, CTAs, or overlays.
- Comparative views: Allows comparison across different videos or audiences.
Why does heatmap analysis for video engagement matter?
Heatmap analysis is highly valuable because it visualises audience attention in a way that numbers alone cannot. A chart of completions may show how many people finished a video, but a heatmap reveals which moments kept them engaged and where they lost interest. This level of insight helps marketers optimise message timing, educators identify challenging concepts, and businesses refine tutorials or onboarding materials to support users more effectively.
What are the benefits of heatmap analysis for video engagement?
The benefits of heatmap analysis include clearer understanding, faster optimisation, and improved outcomes. Clearer understanding comes from instantly seeing attention patterns in a visual format. Faster optimisation follows when teams identify weak spots and edit content for better performance. Improved outcomes are a result of CTAs placed in high-attention zones and when confusing segments are clarified. Features such as video analytics make heatmaps part of broader reporting, turning engagement signals into measurable strategies.
Applications of heatmap analysis for video engagement
Heatmap analysis is applied wherever video is used to persuade, teach, or guide. Marketers use it to test different CTA placements and refine product demos. Educators analyse heatmaps to see where learners replay material, signalling difficult topics. Customer support teams study tutorials to understand which steps are skipped or revisited. In campaign measurement, some of the most common interactive video metrics include heatmaps, offering a practical way to evaluate performance beyond views.
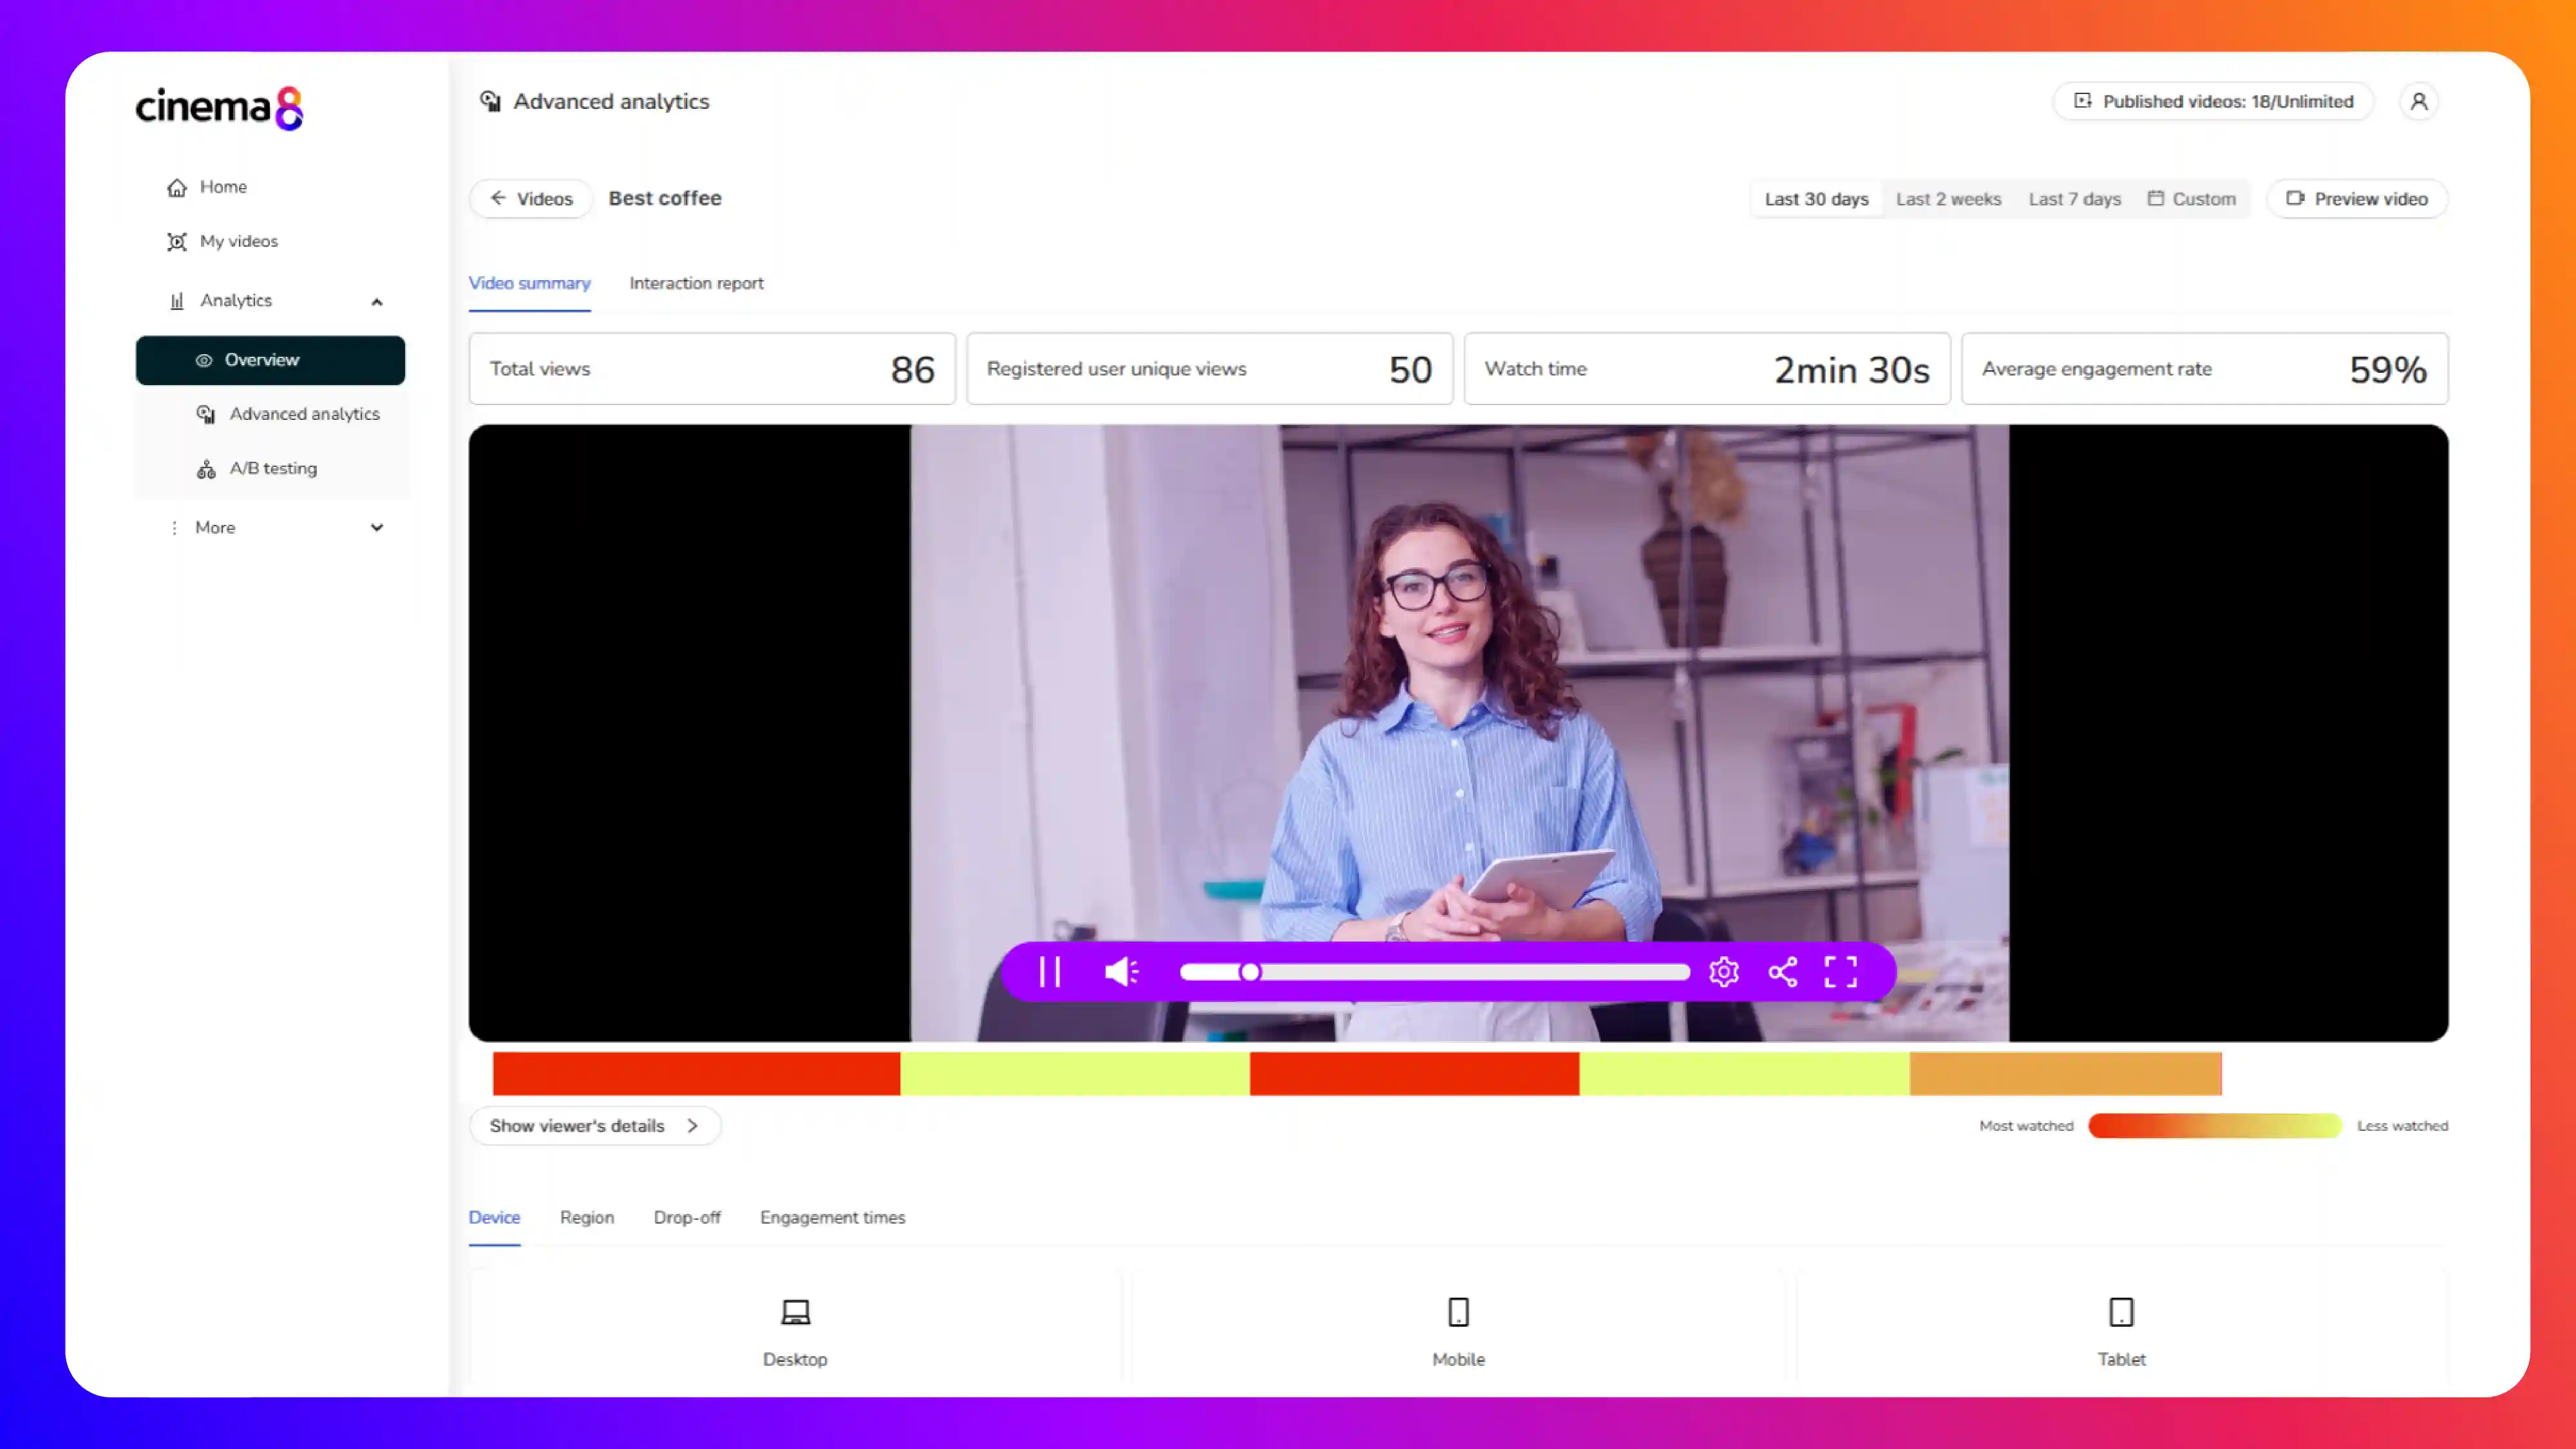
How Cinema8 uses heatmap analysis for video engagement
Cinema8 offers analytics support, providing heatmaps that visualise every interaction within a video, from pauses and replays to clicks on overlays or CTAs. These visual insights sit within a central dashboard, allowing teams to compare results across campaigns or learning modules. By linking heatmaps with interactive features, organisations can see not only where attention is highest but also how it translates into action. As an AI-driven video technology platform designed for growth, Cinema8 helps businesses, educators, and marketers use heatmap analysis to create video strategies that are evidence-based and effective.
Book a demo to see how Cinema8 applies heatmap analysis for video engagement to improve content design, boost viewer retention, and drive measurable results.