What is an analytics dashboard?
An analytics dashboard is a visual workspace that organises performance data into clear, real-time views so teams can monitor what matters and act quickly. For video operations it consolidates plays, audience behaviour, and outcome metrics in one place, turning raw numbers into decisions. The result is faster reporting, shared understanding across departments, and tighter optimisation of campaigns, training, and support content, with less manual effort.
Definition of an analytics dashboard
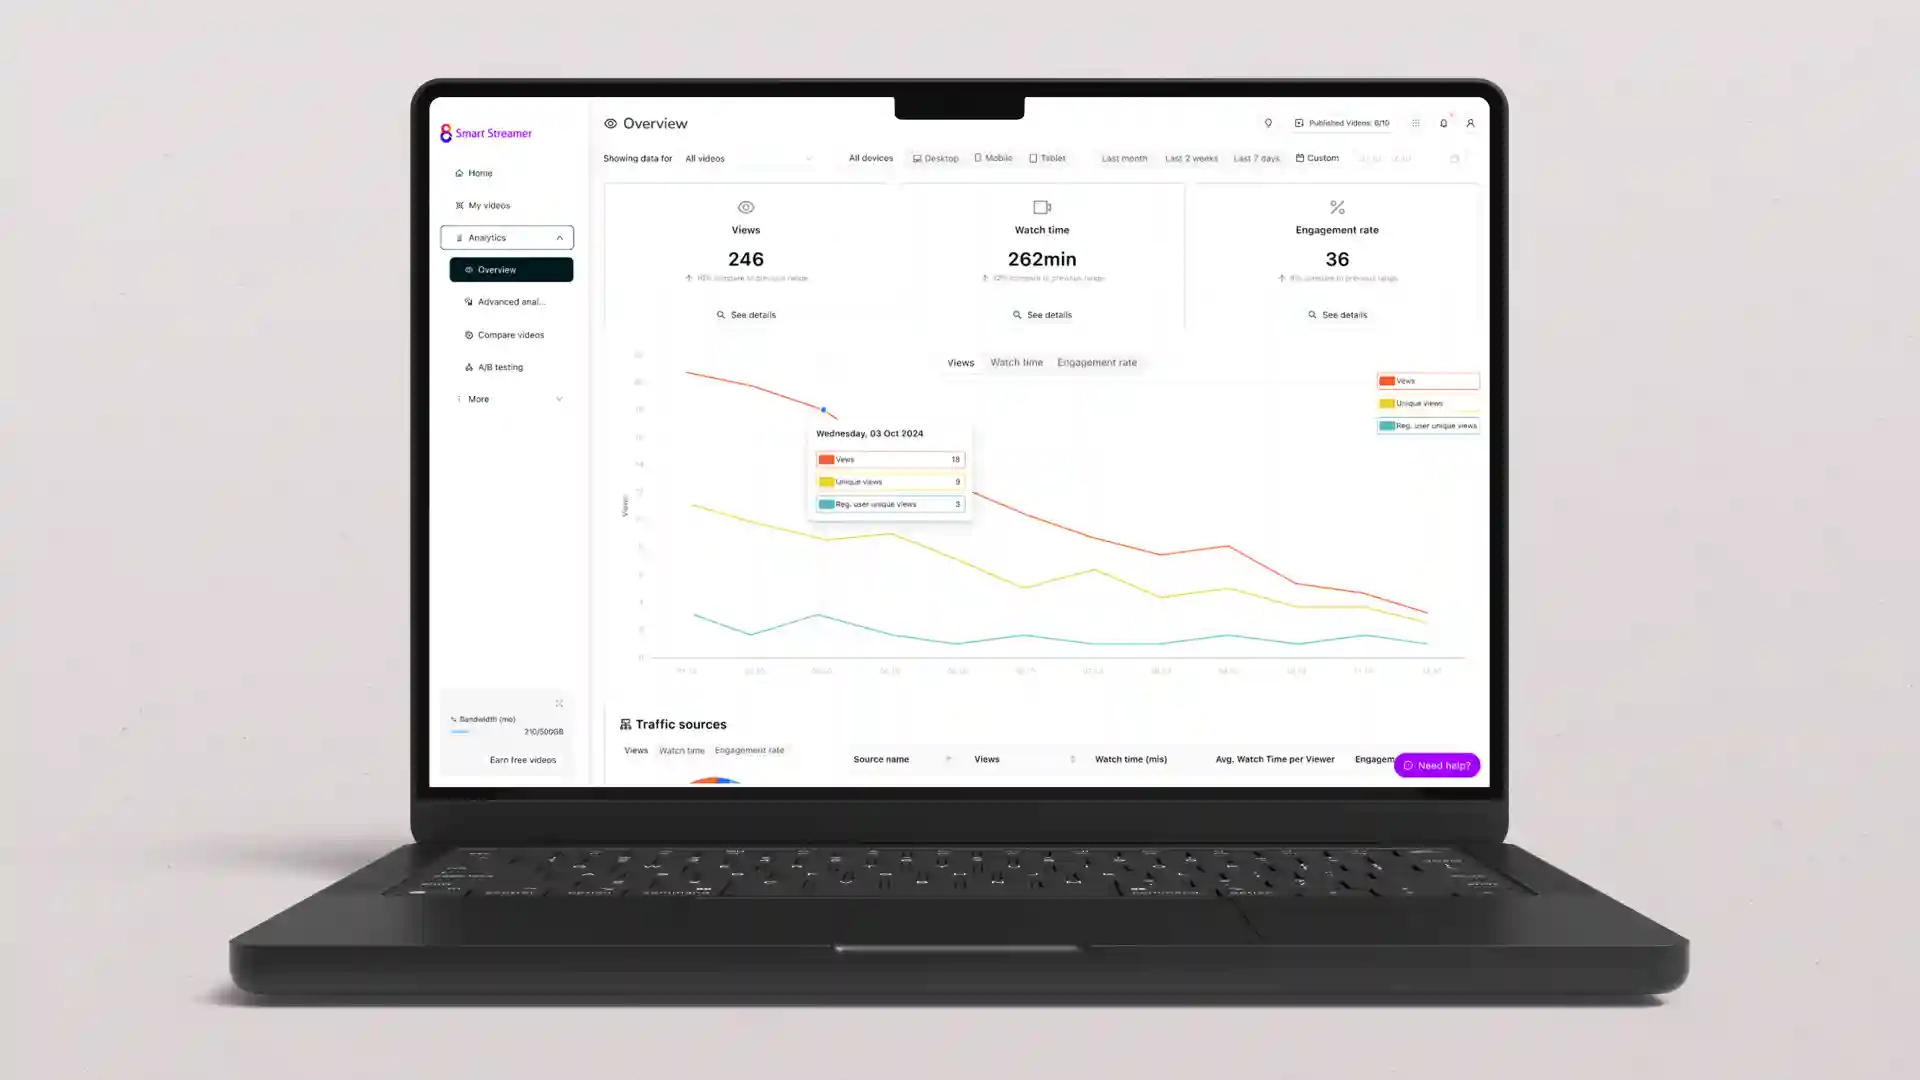
In video hosting, an analytics dashboard presents the core metrics and signals teams need at a glance. These can include:
- KPI overview: Tiles for plays, unique viewers, completion rate, and key outcomes.
- Trend visualisation: Timelines compare days or weeks to reveal shifts.
- Segmentation: Filters by device, geography, traffic source, or audience cohort.
- Comparison: Side-by-side performance for videos, series, or campaigns.
- Sharing and export: Scheduled emails and CSV or BI connectors for stakeholders.
Why does an analytics dashboard matter?
An analytics dashboard is important for teams and individuals needing a single, trustworthy view that replaces scattered reports and ad-hoc spreadsheets. Video hosting platforms that support analytics offer users the ability to see what is resonating, where viewers stop, and which formats or channels deliver results, so action is based on evidence. It's a highly valuable tool that can make a big difference to marketing campaigns, brand videos, and more.
What are the benefits of an analytics dashboard?
The benefits of analytics dashboards are speed, alignment, and smarter allocation of effort. Speed comes from seeing trends without manual data work. Alignment follows when marketing, learning, and leadership teams reference the same view, reducing debate about the numbers. Smarter allocation happens as the dashboard highlights underperforming assets and confirms winners, so budgets, creative time, and distribution focus where they have real impact.
Applications of an analytics dashboard
An analytics dashboard is used in situations where video performance must be monitored and improved. Campaign teams can use an analytics dashboard to track launches in real time and compare channels. Trainers can review lesson completion and refine content for the next cohort. Customer success teams are able to watch adoption of tutorials after releases. Teams and individuals using analytics for interactive video can use an analytics dashboard to assess in-video actions and outcomes.
How Cinema8 uses an analytics dashboard
Cinema8 provides a central dashboard that surfaces views, completion, device and location splits, and comparisons across any library. Teams can filter by audience, tag campaigns, and schedule stakeholder reports. Interactive events such as form submits or CTA clicks appear alongside standard metrics through the video analytics feature, so you can trace the path from viewing to action and decide what to optimise next.
Book a demo to see how Cinema8 applies analytics dashboards to accelerate decisions, align teams, and improve content effectiveness.