What is audience interaction analytics?
Audience interaction analytics measure how viewers engage with video content, including clicks, pauses, choices, and other interactions. Unlike traditional metrics that only track views, interaction analytics provide a deeper understanding of behaviour, showing which elements capture attention and which lose it. These insights help organisations refine content, personalise experiences, and link engagement directly to outcomes such as learning, brand awareness, or conversions.
Definition of audience interaction analytics
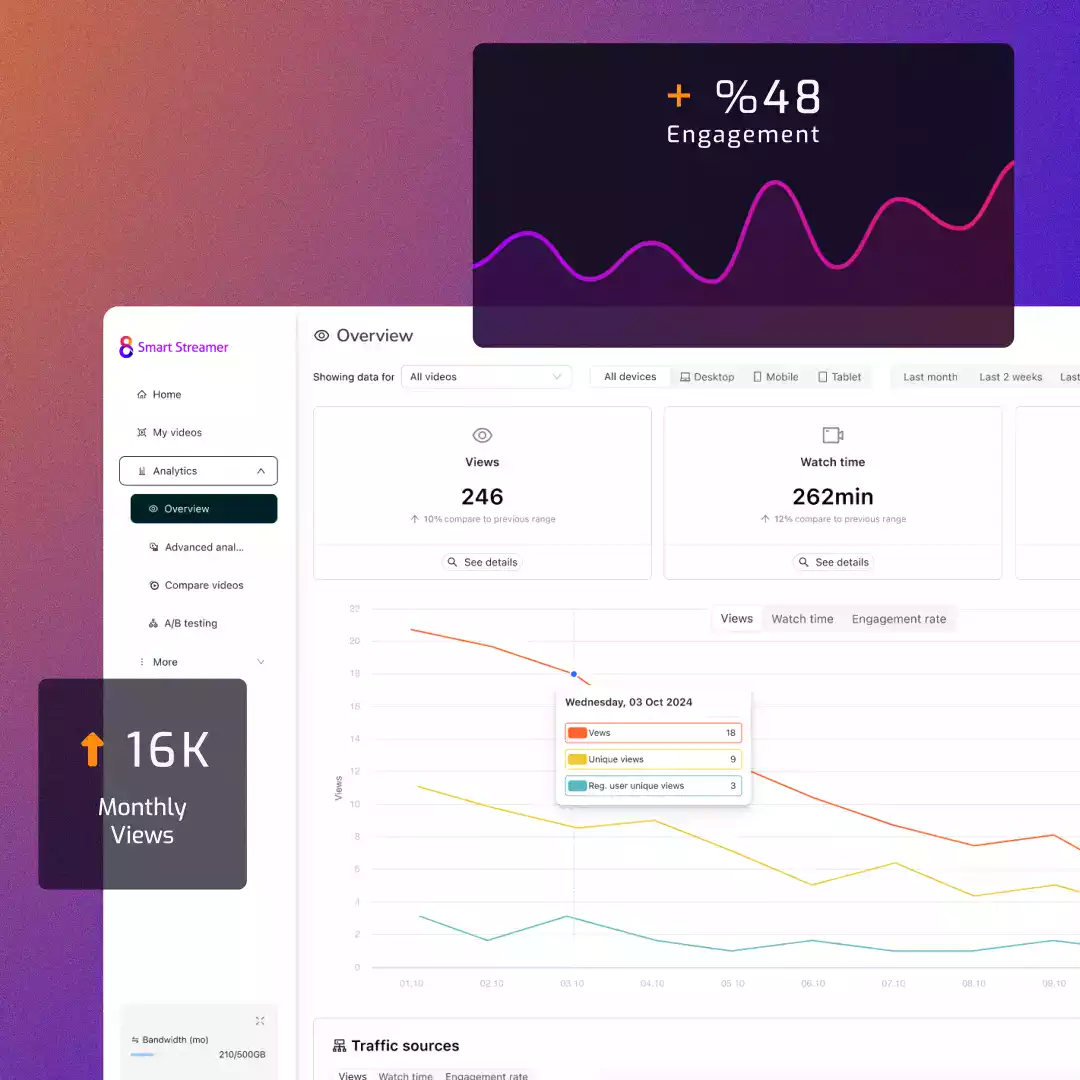
Audience interaction analytics capture detailed data on how viewers actively engage with interactive video content. On advanced video hosting platforms like Cinema8, you can use it to get:
- Engagement signals: Track clicks, pauses, and navigation within the video player.
- Interactive responses: Log quiz answers, branching selections, and survey results.
- Performance insight: Identify which video elements drive engagement and which cause drop-offs.
- Scalable reporting: Organise behaviour data across campaigns, training modules, or enterprise communication.
How does audience interaction analytics work?
Video players with interactive features log every viewer action. These interactions are timestamped, stored, and aggregated in analytics dashboards. Heatmaps can show where attention peaks or drops, while interaction reports highlight which decision points or overlays were most effective. Some platforms also integrate with CRM or BI systems, so video data can be combined with sales or training results for a full picture of impact.
What are the benefits of audience interaction analytics?
The main advantage is understanding why viewers engage. Marketing teams can identify which product features generate the most clicks, while educators can track knowledge gaps based on quiz results. For marketers, this is particularly useful in interactive video for lead generation, where analytics confirm which overlays or forms convert best. For educators, data from interactive video for e-learning highlights how learners respond to different modules and assessments. From a production perspective, this reduces wasted effort, since future videos can focus on proven formats. Interaction data also feeds into video analytics, improving personalisation and making ROI measurable.
Applications of audience interaction analytics
Applications of audience interaction analytics focus on identifying the video elements that drive sales, learning progress, employee participation and audience retention. In marketing, they show which interactive CTAs or shoppable overlays drive conversions. In education, they provide granular data on learner progress and content effectiveness. In enterprise communications, they verify training completion and highlight content employees engage with most. In broadcasting and media, analytics guide interactive formats by showing which paths or storylines viewers prefer. For a deeper look at the platforms that make this possible, see our blog on video hosting services that support analytics.
How Cinema8 video tools use audience interaction analytics
Cinema8 video hosting platform provides an advanced video analytics suite that includes heatmaps of viewer attention, detailed interaction logs, and reports on clicks, choices, and conversions. Teams can run A/B tests to see how changes in CTAs, thumbnails, or branching paths affect results. Data can be exported via API or integrated with CRMs and BI platforms for deeper analysis. With tools like Cinema8’s data bucket, organisations can securely manage large volumes of interaction data while making it actionable for marketing, education, or enterprise training strategies.
By turning raw engagement into usable insights, Cinema8 enables businesses to optimise every stage of their video strategy, from content design to distribution and measurement.